

You are here: Home > Section on Analytical and Functional Biophotonics
Quantitative Biophotonics for Tissue Characterization and Function
- Amir H. Gandjbakhche, PhD, Head, Section on Analytical and Functional Biophotonics
- Victor Chernomordik, PhD, Staff Scientist
- Yasaman Ardeshirpour, PhD, Postdoctoral Fellow
- Franck Amyot, PhD, Guest Researcher
- Jana Kainerstorfer, PhD, Guest Researcher
- Alexander Sviridov, PhD, Guest Researcher
- Fatima A. Chowdhry, MD, Contractor
- Bahar Dasgeb, MD, Volunteer
- Ali Afshari, MS, Predoctoral Student
- Afrooz Azari, MS, Predoctoral Student
- Nader Shahni Karamzadeh, MS, Predoctoral Student
Our general goal is to devise quantitative methodologies and associated instrumentation to bring technology from the Bench to Bedside. We select our projects in the framework of the mission of the National Institute of Child Health and Human Development (NICHD), focusing on childhood and adolescent disorders, as well as abnormal developments of cells such as cancer. We operate in the socalled 4B research mode: at the Blackboard, one models the methodology; at the Bench, one designs the prototype to be brought to the Bedside; at this stage one goes Back to the Blackboard for improving the imaging system.
Structural and functional brain imaging and spectroscopy
Imaging of brain structure and function can help elucidate different biological/clinical manifestations of traumatic brain injury (TBI) and autistic spectrum disorder (ASD). The concept is to localize brain areas for classification of structural and functional abnormalities and, ultimately, for therapeutic intervention. While functional magnetic resonance imaging (fMRI) and positron emission tomography (PET) are the best suited imaging modalities for most functional brain studies, they have some inherent limitations, particularly in the case of low-functioning TBI or ASD subjects. Difficulties in fMRI data acquisition are mainly attributable to the non-friendly environment of the measurement system for children with ASD and ADHD because of their sensitivity to movement restrictions. In this regard, patient-friendly near infrared spectroscopy (NIRS) can become an imaging modality of choice. NIRS and functional near infrared spectroscopy (fNIRS) in particular are emerging technologies for noninvasive measurements of the local changes in cerebral hemodynamic levels associated with brain activity. Owing to the low optical absorption of biological tissues at NIR wavelengths (λ=700–1000 nm), NIR light can penetrate deep enough to probe the outer layers of brain (i.e., cortex), up to about 2–3 cm deep. The NIR absorption spectrum of the tissue is sensitive to changes in the concentration of major tissue chromophores, such as hemoglobin species. Therefore, measurements of temporal variations of backscattered light can capture functionally evoked changes in the outermost cortex and can thus be used to assess the brain functioning. Compared with other well established brain imaging modalities, such as fMRI and PET, this technique offers unique features, including higher temporal resolution of several milliseconds and spectroscopic information about temporal variations in both components of hemoglobin Oxy-[HbO] and deOxy-[Hb], whereas fMRI can assess only deoxy-hemoglobin (Hb) changes. Most importantly for pediatric applications, NIRS instruments are much smaller, less restraining than fMRI or PET and can tolerate subject motion to a larger extent than fMRI. These features make the technique appropriate to study children with such problems as ASD as well as TBI patients, when keeping the subjects still for long periods of time would be extremely challenging.
Owing to neuro-vascular coupling, local changes in oxyhemoglobin and deoxyhemoglobin levels can serve as an indirect measure of brain activity. At first approximation, the levels are proportional to the intensity of the brain activity. We used an action complexity judgment task with a varying degree of cognitive load to produce brain activation. Twenty healthy participants were asked to evaluate the complexity of previously normed daily life action (number of steps to achieve the task) and classify the number of steps as “few” or “many”. We used the linear relationship between changes in the oxy/deoxyhemoglobin ratio and activity complexity to map the activation on the cortex. The mapping was possible with a special registration between MRI anatomical image and the optical sensor. The parametric effect of complexity showed activation in the frontopolar cortex. In our experiments we found that, on average, the activation area corresponded to an angle of Θ=95º and φ=10º. Though the localization of the activation may be less precise with fNIRS than with fMRI (according to fMRI data, this activation area was located at an angle Θ=93º and φ=11º), the parametric analysis, linking cognitive load to cerebrovascular reactivity, may reveal physiological data of greater clinical importance than just the location of the activated area. Our preliminary results, obtained for two TBI patients, show that such parametric studies, based on fNIRS, have the potential to become a discriminator of cognitive function in TBI patients.
To probe changes in oxy- and deoxy-hemoglobin concentrations in the cortex that are caused by brain activity, related to chosen basic tasks, the data are collected at two wavelengths. To assess brain activation in children 4–8 years of age, we used such tests as standard GO/NO-GO, developed to examine the effects of response inhibition and error processing. The NIRS signal was acquired while children were performing the GO/NO-GO task. The NIRS sensor, placed on the child’s forehead, covered Brodmann areas 9, 10 of the prefrontal cortex (PFC). Initial results of fNIRS assessment of the hemodynamic changes in the cortex indicate that mean activation levels (based on changes in oxy-hemoglobin) obtained from left and right prefrontal cortex during both GO and NO-GO trials are much higher in the case of a typical child in that of an ASD child, indicating hypo-activation of prefrontal cortex in the ASD group.
Studies of resting-state and task-based functional connectivity, aiming to identify brain regions similar in functional behavior, have received increased attention over the past few years. Besides healthy populations, different patient groups, including patients with ASD or TBI, have been the subject of functional connectivity (FC) studies. Such studies have identified different connectivity networks in patient groups than in a healthy population. Different imaging modalities have been employed to investigate the brain’s functional connectivity. We attempt to elucidate features of FC by studying both hemodynamic and neural responses of the brain, using different modalities. We recorded hemodynamic activity during the GO/NO-GO task from 11 right-handed subjects with probes placed bilaterally over prefrontal areas. The data permitted reliable detection of fast optical signal (FOS) concurrently with electroencephalogram (EEG) during a GO/NO-GO task. According to NIRS, the hemodynamic responses showed higher task-related activation (an increase/decrease in oxygenated/deoxygenated hemoglobin, respectively) in the right than in the left hemisphere.
Click image to enlarge.
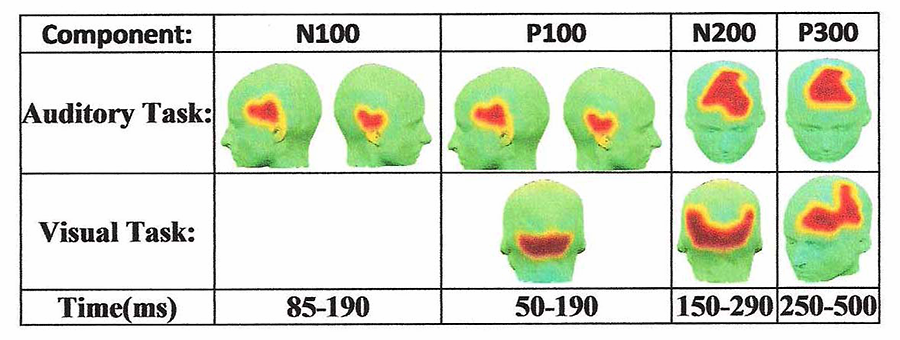
Figure 1. 3-D maps of the functionally connected regions distributed over the scalp for both auditory and visual tasks
Quality Threshold Algorithm (QTA) can follow brain connectivity as a function of known event-related potentials (ERPs) in EEG measurements.
We conducted two studies of FC to identify brain regions that are similar in functional behavior. Our more precise and comprehensive presentation of brain FC was achieved by investigating electroencephalography (EEG) data. We employed a new approach to trace the dynamic patterns of human brain task-based functional connectivity and discovered an FC pattern by combining the cutting-edge artificial intelligence (AI) algorithms [e.g., signal segmentation, dynamic time warping (DTW), and Quality Threshold (QT) clustering techniques]. We recorded the EEG signals of five healthy subjects while they performed an auditory oddball and a visual modified oddball task. To capture the dynamic patterns of functional connectivity during the execution of each task, EEG signals are segmented into durations that correspond to the temporal windows of previously well studied event-related potentials (ERPs). For each temporal window, DTW is employed to measure the functional similarities among channels. Unlike commonly used temporal similarity measures, such as cross correlation, DTW compares time series by taking into consideration that their alignment properties may vary in time. QT clustering analysis is then used to automatically identify the functionally connected regions in each temporal window. For each task, the approach was able to establish a unique sequence of dynamic pattern (observed in all five subjects) for brain functional connectivity. Figure 1 presents the group analysis results showing the 3-D activation maps of functionally connected regions for multiple segments of both the auditory and the modified visual oddball tasks. The red area on the scalp demonstrates the identified functionally connected regions whereas the yellow strip around this area determines the boundary of that region. Using the technique for the auditory task, we identified functionally connected regions corresponding to all the four designated time intervals.
The early diagnostics of brain hematomas is crucial for proper therapy and good prognosis but may not be possible when brain traumas occur in places where the most powerful imaging modalities, MRI and CT, are not easily accessible. For this reason, there is an urgent need for some portable tool to provide fast initial assessment of the brain injury. NIR imaging can become a basis for such system, given that blood is a very strong absorber in this spectral range. Some simplified NIR devices, based on comparison between region of interest (ROI) and contra-lateral side, discussed in the literature, may not detect the presence of symmetrical bilateral hematomas. A hematoma detector would be clinically viable if it could provide proper diagnostics for all types of head hematoma. Motion artifacts present a major challenge for conventional NIR imaging, where random errors in the relative positions of the detectors and ROI contribute to measurement noise. We pursued an idea that the controlled motion of detector fibers over the target can actually provide a useful diagnostic signal. A handheld device, based on this "motion signal," can be used for triaging TBI patients before using more expensive and intensively used imaging techniques. Our idea is to use the variations in the backscattered signal, resulting from the motion of the source-detectors unit over the patient head, as a differential measure. We compare results from two probing depths, realized with one source and two detectors at different separations from the source. While the source-detector pair with smallest separation is expected to probe superficial layers (skin and skull), another is probing the deeper dural region. The system has an integrated high-resolution motion-tracking device to monitor the position of the source detector's head. In order to increase the likelihood of bringing this technology to the bedside, the startup company Archeoptics has obtained an exclusive license. We are preparing a CRADA to help encourage the joint development of this device. We hope that this public-private partnership will create the momentum needed to increase the likelihood of success.
Preclinical studies on fluorescence imaging of HER2–positive breast cancer
Advances in tumor biology created a foundation for targeted therapy aimed at inactivation of specific molecular mechanisms responsible for malignant transformation. The most prominent example of this approach is use of a monoclonal antibody (mAb) trastuzumab antibody-drug conjugate, T-DM1, for treatment of human epidermal growth factor receptor 2 (HER2)–positive cancers. Elevated HER2 expression is associated with increased proliferation and survival of cancer cells and thereby contributes to poor therapy outcomes. Given that the efficacy of the mAb depends on overexpression of its target on tumor cells, techniques to assess the receptor expression are extremely important for monitoring the efficacy of therapy, allowing one to optimize the treatment. Current clinical evaluation of HER2 expression is based on immunohistochemistry (IHC) or fluorescence in situ hybridization (FISH) staining of biopsied tissue. Both methodologies are ex vivo techniques and, given tumor heterogeneity, may deliver false-positive or -negative results and can hardly be used to monitor therapy. On the other hand, molecular imaging, using HER2–specific fluorescently labeled probes, permits assessment of the status of HER2 receptors in vivo and following treatment in real time. After injection, such probes concentrate preferentially at the sites of interest (e.g., in the tumor), providing quantitative information on HER2 expression in vivo. Probe accumulation at the tumor cells can occur in parallel to the delivery of some widely used HER2–specific drugs, such as Trastuzumab, to the diseased site. As a result, HER2 expression can be monitored without interference with the treatment itself, making this contrast agent suitable for an “image and treat” paradigm.
Click image to enlarge.
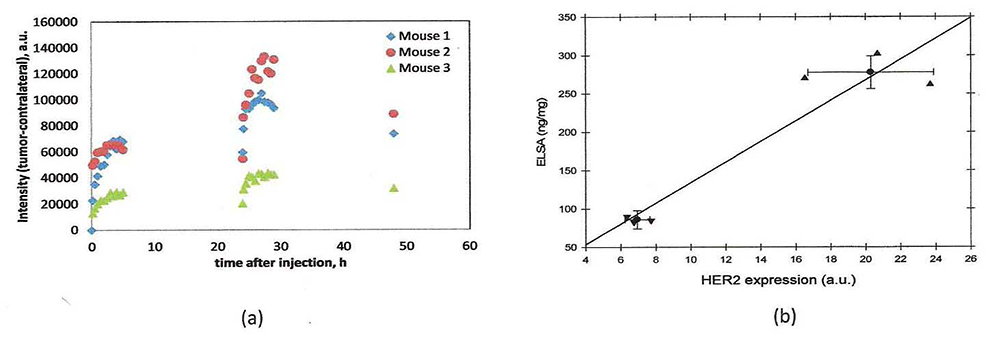
Figure 2. Quantitative assessment of HER2 expressions in tumor xenografts
Non-invasive quantification of HER2 expression in two types of human breast carcinoma xenografts using two injections approach. (a) Fluorescence intensity distributions, as a function of time (two subsequent injections of the probe (raw data). (b) Comparison between HER2 expression,estimated in vivo for mice by normalized rate of accumulation and ELISA readings of HER2 overexpression.
According to our compartmental kinetic model, the quantitative information about HER2 expression level can be extracted from the time dependence of fluorescence intensity, evaluated from a time series of images. Normalized rate of accumulation (NRA) of HER2–specific ligands in the tumor that takes into account the initial concentrations of the free probe ligands in blood is an indicator of the total concentration of HER2 receptors in the tumor, an assumption that is supported by our observations that obtained values of NRA are proportional to overexpression of HER2 of the corresponding tumor type, as measured by ELISA and other methods. We also showed that, using an ABD-Affibody based probe, asymptotic values of fluorescence intensities after similar normalization are proportional to average HER2 expression for different types of breast carcinomas. However, for probes with much faster kinetics, such as those based on monomer Affibody, the relationship between concentration of available HER2 receptors and asymptotic fluorescence intensities is not that straightforward, because a large fraction of receptors can be left unbound for the lack of free fluorescent ligands at longer times. We found that, for probes with fast washout time, such as HER2–specific Affibody-DyLight conjugates, fluorescence imaging based on repeated injections can provide quantitative assessment of HER2 expression level in HER2–positive carcinoma xenografts. The information is extracted from time series of fluorescent images, analyzed in the framework of a kinetic model developed to describe probe binding after each injection. The results show linear correlations between our reconstructed values for HER2 expression, with HER2 expression measured by ELISA ex vivo assays in the same tumors. Analysis of the data, obtained with two subsequent injections of the specific probe, indicates that probe pharmacokinetics permits characterization of overexpression of HER2 in vivo (Figure 2a,b).
Additional information about the tumor characteristics can be extracted from the lifetime fluorescence measurements, including binding affinity of the probe to cancer cells and environmental conditions (e.g., pH) at a given site, based on local variations in the lifetimes for specially designed probes. We have continued our studies on in vivo fluorescence lifetime imaging to monitor the efficacy of treatment. Our preliminary results indicate a significant correlation between measured fluorescence lifetimes and the outcome of the treatment in the mouse model of human carcinoma.
Multispectral imaging
Click image to enlarge.
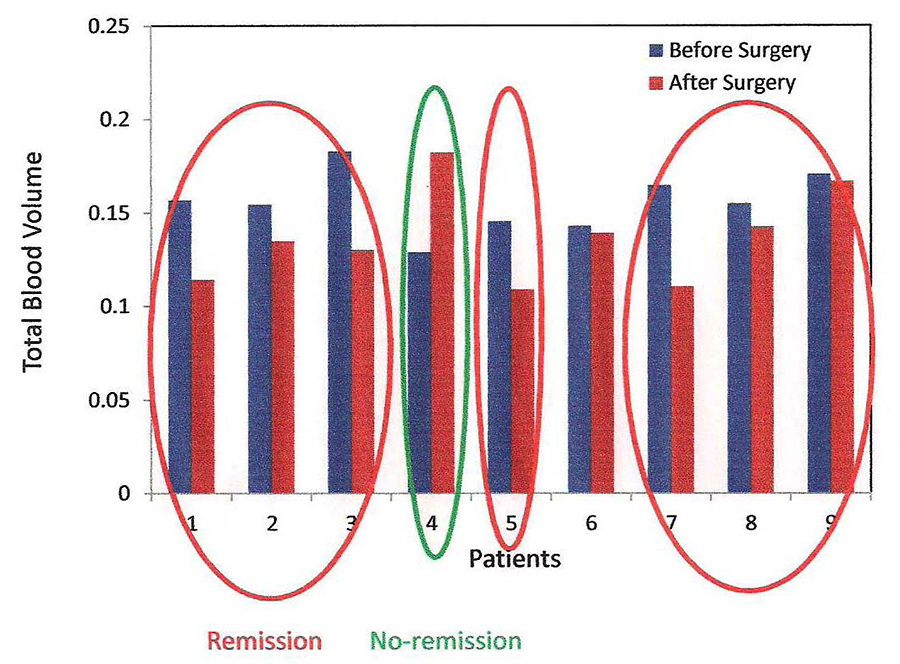
Figure 3. Blood volume changes indicate response to surgery in Cushing's disease patients.
Total blood volume (TBV) measured with a multispectral imaging system at the cheek of nine Cushing's disease patients before and after surgery. We observed a decrease in TBV for seven patients who were in remission. Patient number 4, a non-respondent, has increased blood volume. Patient number 6, a respondent, had no change in TBV.
The oncology community is testing several novel targeted approaches for the treatment of a variety of cancers. With regard to monitoring vasculature, it is desirable to develop and assess noninvasive and quantitative techniques that can not only monitor structural changes but can also assess the functional characteristics or the metabolic status of the tumor. We are investigating three potential, noninvasive imaging techniques to monitor patients undergoing experimental therapy: infrared thermal imaging (thermography), laser Doppler imaging (LDI), and multi-spectral imaging. We are testing the imaging techniques on subjects with Kaposi's sarcoma (KS), a highly vascular tumor that occurs frequently in patients infected with HIV. Cutaneous KS lesions are easily accessible for noninvasive techniques to image tumor vasculature and thus represent a tumor model in which to assess parameters of angiogenesis. We are involved in four different NCI protocols. Our multi-modality techniques can non-invasively monitor the functional properties of the tumor and surrounding tissues and have the potential to predict treatment outcomes. We recently obtained angiogenic markers (blood volume and oxygenation) in real time. Using novel data analysis tools based on Principal Component Analysis (PCA), we showed that a KS lesion can be imaged and the functional state of the tumor assessed in real time. In combination with optical coherence tomography (OCT), we recently obtained quantitative measures of blood volume and oxygenation in real time. The ultimate goal is to further evaluate diffuse multispectral imaging as a potential supplement to existing response assessment in KS, providing an early non-invasive marker of treatment efficacy. In our preliminary experiments, multi-spectral images of KS skin lesions were taken over the course of treatment, and blood volume and oxygenation concentration maps were obtained through PCA of the data. Corresponding images were compared with clinical and pathological assessment, provided by conventional means. In agreement with our hypothesis that successful treatment would decrease the blood volume in the lesions, the normalized standard deviation for blood volume fell in each of the five patients whose lesion responded to treatment, while the normalized standard deviation for blood volume rose in the two patients whose lesion did not respond to therapy. The initial results confirm that concentrations of oxygenated hemoglobin in the tumor can become a quantitative marker of tumor response to the therapy.
In collaboration with the Section on Genetics and Endocrinology at NICHD, Cushing's disease patients are imaged with the multispectral system before and after surgery. Our working hypothesis is that responders to the surgery will show decrease in blood volume in their cheeks, the plasma cortisol being indicative of response. So far, seven of the eight patients were surgically cured of disease according to post-operative measurements of plasma cortisol. The early results by multispectral imaging (MSI) on the right cheek of the cured patients prior to surgery and a mean of 7 ± 3 days after surgery showed a significant decrease in total blood volume when measured before and after surgery. In contrast, for the only patient in our sample who was not surgically cured, the fraction of blood volume increased from pre to post-operative measurements. For one patient only, a responder, no difference was detected. In this pilot study, preliminary data indicate that a decrease in facial plethora after surgery correlates with cure of Cushing's disease (see Figure 3).
Additional Funding
- Bench to Bedside Award
- Center for Neuroscience and Regenerative Medicine
- NIBIB
Publications
- Ardeshirpour Y, Zielinski R, Chernomordik V, Capala J, Griffiths G, Vasalatiy O, Achilefu S, Gandjbakhche A, Hassan M. In vivo fluorescence lifetime imaging monitors binding of specific probes to cancer biomarkers. PLoS One 2012;7(2):e31881.
- Riley JD, Amyot F, Pohida T, Pursley R, Ardeshipour Y, Kainerstorfer JM, Najafizadeh L, Chernomordik V, Smith P, Smirniotopoulos J, Wassermann EM, Gandjbakhche AH. A hematoma detector—a practical application of instrumental motion as signal in near infra-red imaging. Biomed Optics Express 2012;3(1):192-205.
- Amyot F, Zimmermann T, Riley J, Kainerstorfer JM, Chernomordik V, Mooshagian E, Najafizadeh L, Krueger F, Gandjbakhche AH, Wassermann EM. Normative database of judgment of complexity task with functional near infrared spectroscopy—application for TBI. Neuroimage 2012;60(2):879-883.
- Ardeshirpour Y, Hassan M, Zielinsky R, Horton A., Capala J, Gandjbakhche A. Chernomordik V. In vivo assessment of HER2 receptor density in HER2-positive tumors by near-infrared imaging, using repeated injections of the fluorescent probe. Technol Cancer Res Treat 2013;1:Epub ahead of print.
- Karamzadeh N., Medvedev A., Azari A., Gandjbakhche A., Najafizadeh L. Capturing dynamic patterns of task-based functional connectivity with EEG. NeuroImage 2013;66:311-317.
Collaborators
- Samuel Achilefu, PhD, Washington University School of Medicine, St. Louis, MO
- Robert Balaban, PhD, Laboratory of Cardiac Energetics, NHLBI, Bethesda, MD
- Claude Boccara, PhD, École Supérieure de Physique et de Chimie Industrielles, Paris, France
- Kevin Camphausen, PhD, Radiation Oncology Branch, NCI, Bethesda, MD
- Jacek Capala, PhD, Radiation Oncology Branch, NCI, Bethesda, MD
- Christian Combs, PhD, Light Microscopy Facility, NHLBI, Bethesda, MD
- Stavros Demos, PhD, Lawrence Livermore National Laboratory, Livermore, CA
- Ramon Diaz-Arrastia, MD, PhD, Uniformed Services University of the Health Sciences, Bethesda, MD
- Israel Gannot, PhD, Tel Aviv University, Tel Aviv, Israel, and The George Washington University, Washington, DC
- Gary Griffiths, PhD, Imaging Probe Development Center, NIH, Rockville, MD
- Alan Halpern, MD, Memorial Sloan-Kettering Cancer Center, New York, NY
- Ilko Ilev, PhD, Office of Science and Engineering Laboratories, FDA, Bethesda, MD
- Jay Knutson, PhD, Laboratory of Molecular Biophysics, NHLBI, Bethesda, MD
- Ralph Nossal, PhD, Program in Physical Biology, NICHD, Bethesda, MD
- Sinisa Pajevic, PhD, Division of Computational Bioscience, CIT, NIH, Bethesda, MD
- Tom Pohida, MS, Division of Computational Bioscience, CIT, NIH, Bethesda, MD
- Dan Sackett, PhD, Program in Physical Biology, NICHD, Bethesda, MD
- Alexsandr Smirnov, PhD, Light Microscopy Facility, NHLBI, Bethesda, MD
- Paul Smith, PhD, Division of Bioengineering and Physical Science, Office of Research Services, NIH, Bethesda, MD
- Eric Wassermann, MD, Cognitive Neuroscience Section, NINDS, Bethesda, MD
- Robert Yarchoan, MD, HIV and AIDS Malignancy Branch, NCI, Bethesda, MD
- Rafal Zielinski, PhD, Radiation Oncology Branch, NCI, Bethesda, MD
Contact
For more information, email amir@helix.nih.gov.