

You are here: Home > Section on Analytical and Functional Biophotonics
Quantitative Biophotonics for Tissue Characterization and Function
- Amir H. Gandjbakhche, PhD, Head, Section on Analytical and Functional Biophotonics
- Victor Chernomordik, PhD, Staff Scientist
- Yasaman Ardeshirpour, PhD, Postdoctoral Fellow
- Franck Amyot, PhD, Guest Researcher
- Jana Kainerstorfer, PhD, Guest Researcher
- Alexander Sviridov, PhD, Guest Researcher
- Fatima A. Chowdhry, MD, Contractor
- Bahar Dasgeb, MD, Volunteer
- Ali Afshari, MS, Predoctoral Student
- Afrouz Azari, MS, Predoctoral Student
- Nader Shahni Karamzadeh, MS, Predoctoral Student
Our general goal is to devise quantitative methodologies and associated instrumentation to bring technology from the Bench to Bedside. We select our projects in the framework of the mission of the National Institute of Child Health and Human Development (NICHD), focusing on childhood and adolescent disorders, as well as abnormal developments of cells such as cancer. We operate in the so-called 4B research mode: at the Blackboard, one models the methodology; at the Bench, one designs the prototype to be brought to the Bedside; at this stage one goes Back to the Blackboard for improving the imaging system.
Structural and functional brain imaging
Traumatic brain injury (TBI) and autism spectrum disorder (ASD) are two neurological disorders with different biological and clinical presentations that have gained the public's interest in the past few years owing to the very wide spectrum into which each disorder falls. TBI can range from mild to moderate to severe, with many caveats. In ASD, the classification has been completely reorganized in the current DSM-V to fall within four categories: autistic disorder, Asperger’s disorder, childhood disintegrative disorder, and pervasive developmental disorder. Imaging the brain, with a focus on its structure and function, can help to clarify some of the idiosyncrasies that render diagnosis difficult. Some of the more traditional imaging modalities, such as functional magnetic resonance imaging (fMRI) and positron emission tomography (PET) are better suited for most functional brain studies, but there are some natural limitations, particularly in the case of low-functioning TBI or ASD subjects. One of the most common and challenging is that a subject is required to remain immobile, sometimes for lengthy periods during testing. Given their sensitivity to movement restrictions and unfriendly environment, children with ASD and ADHD present difficulties for fMRI data acquisition. In this regard, more patient-friendly near infrared spectroscopy (NIRS) could be the imaging modality of choice. NIRS and functional near-infrared spectroscopy (fNIRS), in particular, are technologies for noninvasive measurements of the local changes in cerebral hemodynamic levels associated with brain activity. Owing to the low optical absorption of biological tissues at NIR wavelengths (λ=700–1000 nm), NIR light can penetrate deep enough to probe the outer layers of brain (i.e., cortex), up to about 2–3 cm deep. The NIR absorption spectrum of the tissue is sensitive to changes in the concentration of major tissue chromophores, such as hemoglobin species. Therefore, measurements of temporal variations of backscattered light can capture functionally evoked changes in the outermost cortex and can thus be used to assess brain functioning. Compared with other well-established brain imaging modalities, such as fMRI and PET, the technique offers unique features, including higher temporal resolution of several milliseconds and spectroscopic information about temporal variations in both components of hemoglobin, oxy-hemoglobin (HbO) and deoxy-hemoglobin (Hb), whereas fMRI can assess only changes in Hb. Most importantly for pediatric applications, NIRS instruments are much smaller, less restraining than fMRI or PET, and can tolerate subject motion to a larger extent than can fMRI.
Owing to its high metabolic demand and dynamic nature, the brain requires a rapid yet precise mechanism of oxygen delivery. Given that oxygen is transported by means of binding to hemoglobin molecules, local changes in concentrations of hemoglobin species (HbO and Hb) arising from mental tasks can provide an indirect measure of brain activity. To realize this approach, in collaboration with Ramon Diaz-Arrastia, we enrolled 65 subjects, both healthy individuals and TBI patients, in a clinical protocol to follow changes in brain activation (cerebral hemodynamics) in response to an action-complexity judgment task with a varying degree of cognitive load. First, we were able to map the activation at the frontopolar cortex, using co-registration between the optical sensor and MRI anatomical image. Results of fNIRS mapping are consistent with those of fMRI (within 1–2° error in polar coordinates). Our preliminary studies demonstrated the link between cognitive load and cerebrovascular activity. Observed differences between patients suffering from severe TBI and healthy controls in their responses to varying degrees of cognitive load show that application of fNIRS for such parametric studies could be used to assess impairment of cognitive function in TBI patients, thus providing clinical information on the status of TBI (e.g., resolved or not resolved TBI).
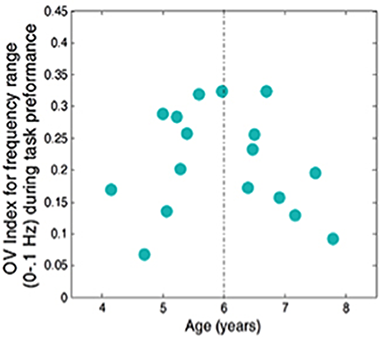
Figure 1. Oxygen variability (OV) index vs. age for seventeen subjects for frequencies related to autoregulation (less than 0.1 Hz) during the task
The OV index is defined as the dimensionless ratio of standard deviation to mean of oxygen saturation data.
Temporal variations in the concentration of HbO and Hb can reveal the cerebral hemodynamics of functional brain activity that can be captured by fNIRS. In particular, the variations provide information about cerebral autoregulation (CA), the mechanism that optimizes oxygen delivery to the brain. Specifically, CA maintains constant cerebral blood flow (CBF), regardless of changes in atrial blood pressure, and is thus vital for brain function. The purpose of our current study is to find a metric to quantify the hemodynamic variations related to cerebral CA and their relationship to children’s development. We used frequency analysis of oscillatory patterns from fNIRS to formulate a new metric of variations in local oxygen saturation. To characterize the metric, we introduced an Oxygen Variability Index (OV Index) and analyzed two frequency bands (below 0.1 Hz and 0.2–0.3 Hz, related to CA and respiration, respectively). We then examined the relationship between the OV Index in these two bands and age in a group of normally developing children. Instantaneous amplitude and phase of HbO and Hb variations were obtained from the filtered fNIRS data using an algorithm based on an analytic signal continuation. Combining the data for both hemoglobin species, we were able to quantify instantaneous oxygen saturation (SO2). The OV index is defined as the dimensionless ratio of standard deviation to the mean of SO2 data. The index therefore assesses the variability of SO2 during a functional task at a given frequency band. fNIRS data were collected from 17 children (ages 4–8 years) while they performed a standard Go-NoGo task. The results show differences in variability of oscillations of SO2 between the two different bands. Variations in OV index in children indicated a dynamic relationship between age and hemodynamic CA oscillations in frequency band below 0.1 Hz (Figure 1). Specifically, we found a significant quadratic effect of age that included a parabola peaking just before 6 years of age. The linear fit for the group of children below age 6 also indicated a strong linear correlation between age and OV index for ages 4–6. The significant relationship between age and OV index is in line with studies using other modalities that show a similar relationship between cerebral blood flow and age. In addition, we found much higher variability in frequencies associated with CA than for respiration across subjects. The physiological reasons for an increase in CA peaking at age 6 are not fully understood. Peak values of the OV index at around age 6 years may be related to other neurophysiological changes occurring at that time, which require increased regulation of CBF (Figure 1).
Our method allows us to quantify the mechanism of CA and eventually to measure the relationship between developmental changes in CA and subsequently between CA and brain function and its impairments. Analysis of hemodynamic oscillations originating from CA does not provide a full picture of this complicated phenomenon. However, using fNIRS, the suggested approach might allow one to link changes in cerebral hemodynamics with developmental and functional changes. As a non-invasive and patient-friendly method, it can be used to monitor brain development and possibly detect impairments of CA in both typical and atypical groups such as ASD and ADH individuals.
Click image to enlarge.
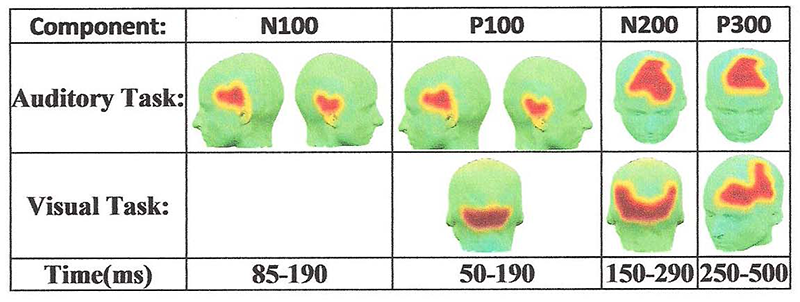
Figure 2. 3-D maps of the functionally connected regions distributed over the scalp for both auditory and visual tasks
The Quality Threshold Algorithm (QTA) can follow brain connectivity as a function of known event-related potentials (ERPs) in EEG measurements.
Studies of resting-state and task-based functional connectivity (FC), aiming to identify brain regions similar in functional behavior, have received mounting attention over the past few years. Using different modalities, we attempt to extract features of FC by studying both hemodynamic and neural responses of the brain. We recorded hemodynamic activity during a Go/No-Go task from 11 right-handed subjects with probes placed bilaterally over prefrontal areas. Using the data, we demonstrated reliable detection of a fast optical signal (FOS) concurrently with an electroencephalogram (EEG) during the Go/No-Go task. According to NIRS, the hemodynamic responses showed higher task-related activation (an increase/decrease in HbO/Hb hemoglobin, respectively) in the right versus left hemisphere. We also employed a new approach to trace, with EEG, the dynamic patterns of human brain task-based functional connectivity. The EEG signals of five healthy subjects were recorded while they performed an auditory oddball and a visual modified oddball task. To capture the dynamic patterns of functional connectivity during the execution of each task, EEG signals are segmented into duration that correspond to the temporal windows of previously well-studied event-related potentials (ERPs) (Figure 2). We also introduced and validated a novel time-series feature extraction technique, Relative Brain Signature (RBS), that can be applied to ERP signals to provide an effective dimensionality reduction, does not require the typical channel-selection procedure, and accounts for all the ERP signals. Unlike common feature-extraction techniques, the RBS technique obtains information from subjects’ ERP by considering the status of their relationship to the given population of the study. RBS combines vector space analysis and orthogonal subspace projection to generate feature vectors that signify the corresponding population of the subjects (Figure 3). The proposed technique can be used to identify the biomarkers related to a specific population and to localize functional biomarkers.
In pursuit of an idea that would use the controlled motion of detector fibers over a target to provide useful diagnostic signals in the form of a handheld device, the hematoma detector, as it is known, was created, which would provide an excellent tool for use in the field to triage TBI patients so as to rule out a possible hematoma and to avoid more labor-intensive imaging tools. The technology was fine-tuned to be applicable to the bedside by creating the startup company Archeoptics.
Click image to enlarge.
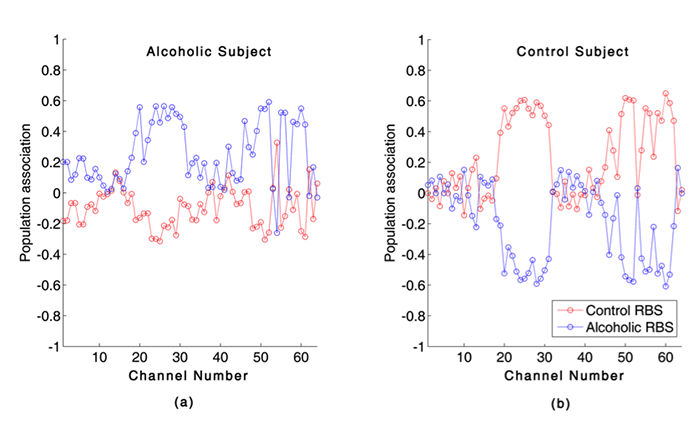
Figure 3. Relative Brain Signature (RBS) vectors for an alcoholic and a control subject are illustrated. Two RBS vectors for an alcoholic subject and a control subject are shown.
The components of the RBS vectors quantify the association of an event-related potential (ERP) waveform and the alcoholic population (shown in blue) or to the control population (shown in red). A positive value closer to 1 for a component of the RBS vectors indicates a stronger association with a certain population, whereas smaller positive values and the negative values suggest that the corresponding ERP data are weakly associated with a population. In panel a, the majority of Alcoholic-RBS component values are significantly associated with the alcoholic population, while for the Control-RBS component values, the majority of the ERPs were weakly associated with the control population. In panel b, Control-RBS component values illustrate a strong association with the control population while Alcoholic-RBS demonstrates weak association with the alcoholic population.
Multispectral imaging
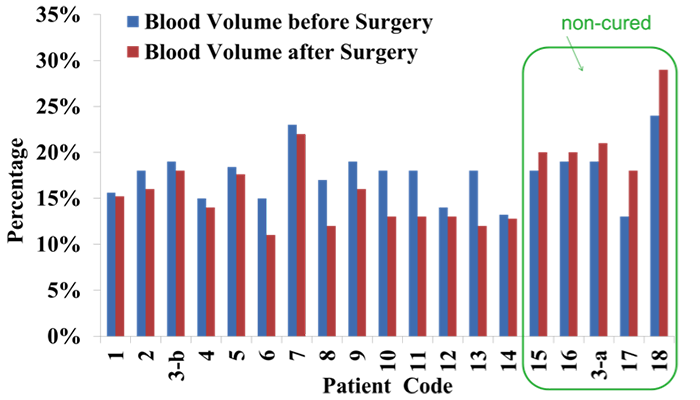
Facial redness is one of the earliest described clinical features of Cushing's syndrome (CS). In collaboration with Constantine Stratakis, we began a study aimed at quantifying changes in facial plethora in CS as an early assessment of cure. We are recruiting Cushing's patients for optical imaging before and after surgery and at two session follow-ups, 6 months and one year after their surgery. Twenty patients with CS (14 female, mean age 19.8 ± 12.3) were studied so far. Among these patients, 17 patients had ACTH–secreting pituitary tumors-Cushing's disease (CD), two had ACTH–independent adrenocortical tumors, and one had an ectopic ACTH–secreting pulmonary carcinoid. Two patients with CD were excluded from the study, one due to severe facial acne and the second because of fever on the day of imaging. One of the patients required two consecutive surgeries as the initial trans-sphenoidal surgery was unsuccessful. Non-invasive multi-spectral near-infrared imaging was performed on the right cheek of the patients before and 5.6 ± 3.9 days after surgery. Patients were defined as cured of disease by postoperative measurements of plasma cortisol of less than 3 mcg/dl and/or adrenocortical insufficiency, for which they received replacement. Clinical data obtained from the 18 patients indicate that a reduction in facial plethora after surgery, as evidenced by lowered blood volume fraction, is well correlated with cure of CS. The results of the study were presented in Annual Meeting of Endocrinology (ENDO) 2014, San Francisco (Figure 4).
Click image to enlarge.
Figure 4. Blood volume fraction of the Cushing's patients’ right cheek before and after trans-sphenoidal surgery
We are pursuing Kaposi Sarcoma (KS) studies in ongoing clinical trials under four different NCI protocols and therapeutic agents. The goal is to further evaluate diffuse multispectral imaging as a potential supplement to existing response assessment in KS, providing an early non-invasive marker of treatment efficacy. In our preliminary work, we made multi-spectral images of Kaposi Sarcoma skin lesions over the course of treatment and obtained blood volume and oxygenation concentration maps through Principal Component Analysis (PCA) of the data. Corresponding images were compared with clinical and pathological assessment provided by conventional means. In agreement with our hypothesis that successful treatment would reduce blood volume in the lesions, the normalized standard deviation for blood volume declined in each of the five patients whose lesion responded to treatment, while the normalized standard deviation for blood volume rose in the two patients whose lesion did not respond to therapy. These initial results confirm that concentrations of HbO in the tumor can be used as a quantitative marker of tumor response to the therapy.
Preclinical studies on fluorescence imaging of HER2–positive breast cancer
Detection of specific oncogenic biomarkers is an important factor in choosing the proper targeted cancer therapy. Current cancer therapy is focused on drugs that selectively attack the cancer-causing biomarkers, inactivate molecular mechanisms responsible for cell malignancy, and deliver the toxin specifically to the malignant cells. The most prominent example of this approach is the use of the monoclonal antibody (mAb) Trastuzumab antibody-drug conjugate, T-DM1, to treat human epidermal growth factor receptor 2 (HER2)–positive cancers. Elevated HER2 expression is associated with increased proliferation and survival of cancer cells, thereby contributing to poor therapy outcomes. Given that the efficacy of the mAb depends on overexpression of its target on tumor cells, development of techniques to assess receptor expression is extremely important for monitoring the efficacy of therapy and optimizing treatment. Current clinical evaluation of HER2 expression is based on immunohistochemistry (IHC)– or fluorescence in situ hybridization (FISH)–staining of biopsied tissue. Both are ex vivo techniques and, owing to tumor heterogeneity, may deliver false-positive or false-negative results and are therefore unreliable for monitoring therapy. By contrast, molecular imaging using HER2–specific fluorescently labeled probes allows assessment of the status of HER2 receptors in vivo and the following of treatment in real time. After injection, probes such as the HER2–specific Affibody concentrate in the tumor. Probe accumulation at tumor cells can occur in parallel with the delivery of some HER2–specific drugs, such as Trastuzumab, to the malignant tumor. As a result, HER2–specific Affibody fluorescent probes can be used to monitor HER2 expression without interfering with the treatment itself, making this probe suitable for an image-and-treat paradigm.
Besides the information that can be extracted from the serial imaging of fluorescence intensity at different time points, additional information about tumor characteristics can be extracted from lifetime fluorescence measurements, including binding affinity of the probe to cancer cells and environmental conditions (e.g., pH), based on local variations in lifetimes for specially designed probes at a given site.
Click image to enlarge.
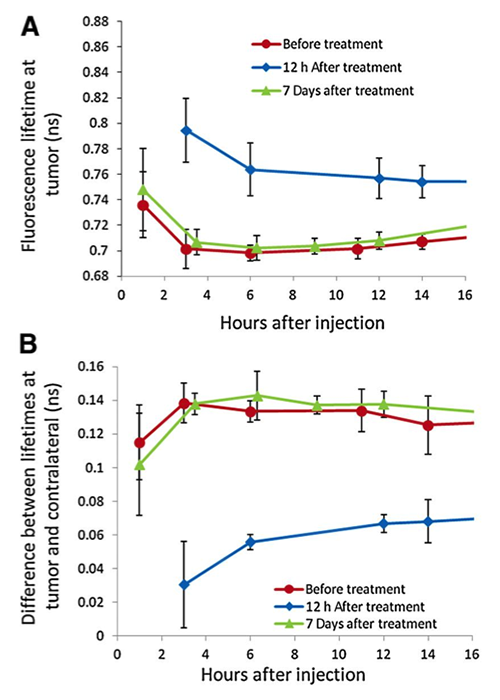
Figure 5. Fluorescence lifetimes at the tumor
A: The average fluorescence lifetime at the tumor site for 5 mice at different time points after injection of ABD-HER2–specific Affibody probe; before, 12 hours, and one week after the last treatment with 17-DMAG.
B: The difference between the fluorescence lifetimes at the tumor and contralateral site for the same mice as in panel A.
We studied the potential of in vivo fluorescence lifetime imaging to monitor the efficacy of treatment, in particular the feasibility of fluorescence lifetime imaging to monitor in vivo expression of the HER2 receptor in a breast carcinoma (mouse model) during the course of treatment. We observed a considerable difference (>130 ps) between the fluorescence lifetime of HER2–specific optical probes at the tumor and a contralateral site before and seven days after the last treatment with 17-DMAG (an HSP90 inhibitor), when the tumor regrew to almost its pretreatment volume. However, soon after the therapy (12 hours), when the effect of drug on HER2 degradation is maximal, the difference decreased significantly. Based on our previous findings on the relationship between fluorescence lifetime and binding of HER2–specific probe to corresponding receptors, we believe that the differences between the fluorescence lifetimes at the tumor and contralateral site, observed for mice with BT-474 xenografts after treatment with 17-DMAG, result from the strong downregulation of HER2 receptors soon after the therapy (i.e., less binding sites for the HER2–specific probe) and corresponding changes in the fraction of bound to total fluorescent probes in the tumor. Immediately after treatment, the fraction of bound to total fluorophores inside the tumor changed considerably, resulting in a noticeable increase in the average fluorescence lifetime. Subsequent tumor and HER2 expression recovery a week later caused gradual restoration of the original level of the binding ratio of HER2–targeting probe in the tumor and a corresponding return to pre-treatment values of the fluorescence lifetime. The results reveal that fluorescence lifetime imaging, based on evaluating the fraction of the bound and unbound fluorophores inside the tumor, can be used as an alternative in vivo imaging approach to characterize tumors, separate high from low HER2–expression tumors, and monitor the efficacy of targeted therapies (Figure 5).
In collaboration with Alan Halpern, we conducted a pilot study to determine the affinity and selectivity of BerEp4 antibody conjugated with fluorescence probe and to assess its possible use in designing theranostic probes for basal cell carcinoma (BCC). The most common cancer in humans, BCC appears macroscopically and microscopically similar to many other skin lesions, which makes differential diagnosis difficult. Based on the initial cell culture results, BerEP4 appears to be a promising biomarker for molecular imaging of BCC and can be used in conjunction with in vivo near-infrared fluorescence imaging. To prepare BerEP4 for eventual theranostic use, the feasibility of a combined macro-/micro-optical approach to imaging BCC was examined with various histologies.
Additional Funding
- Bench to Bedside Award
- Center for Neuroscience and Regenerative Medicine
- NIBIB
Publications
- Dasgeb B, Smirnov A, Ardeshirpour Y, Gandjbakhche A, Halpern A, Knutson JR, Mehregan D, Sackett DL. Multi-scale BerEp4 molecular imaging of microtumor phantom towards theranostics for basal cell carcinoma. Mol Imaging 2014;13:1-9.
- Combs CA, Smirnov A, Glancy B, Karamzadeh NS, Gandjbakhche AH, Redford G, Kilborn K, Knutson JR, Balaban RS. Compact non-contact total emission detection for in vivo multiphoton excitation microscopy. J Microsc 2014;253(2):83-92.
- Ardeshirpour Y, Chernomordik V, Hassan M, Zielinski R, Capala J, Gandjbakhche A. In vivo fluorescence lifetime imaging for monitoring the efficacy of the cancer treatment. Clin Cancer Res 2014;20(13):3531-3539.
- Kainerstorfer JM, Polizzotto MN, Uldrick TS, Rahman R, Hassan M, Najafizadeh L, Ardeshirpour Y, Wyvill KM, Aleman K, Smith PD, Yarchoan R, Gandjbakhche AH. Evaluation of non-invasive multispectral imaging as a tool for measuring the effect of systemic therapy in Kaposi sarcoma. PLoS One 2013;8(12):e83887.
- Karamzadeh N, Medvedev A, Azari A, Gandjbakhche A, Najafizadeh L. Capturing dynamic patterns of task-based functional connectivity with EEG. NeuroImage 2013;66:311-317.
Collaborators
- Samuel Achilefu, PhD, Washington University School of Medicine, St. Louis, MO
- Robert Balaban, PhD, Laboratory of Cardiac Energetics, NHLBI, Bethesda, MD
- Claude Boccara, PhD, École Supérieure de Physique et de Chimie Industrielles, Paris, France
- Kevin Camphausen, PhD, Radiation Oncology Branch, NCI, Bethesda, MD
- Jacek Capala, PhD, Radiation Oncology Branch, NCI, Bethesda, MD
- Christian Combs, PhD, Light Microscopy Facility, NHLBI, Bethesda, MD
- Stavros Demos, PhD, Lawrence Livermore National Laboratory, Livermore, CA
- Ramon Diaz-Arrastia, MD, PhD, Center for Neuroscience and Regenerative Medicine, Uniformed Services University of the Health Sciences, Bethesda, MD
- Israel Gannot, PhD, Tel Aviv University, Tel Aviv, Israel, and The George Washington University, Washington, DC
- Gary Griffiths, PhD, Imaging Probe Development Center, NIH, Rockville, MD
- Alan Halpern, MD, Memorial Sloan-Kettering Cancer Center, New York, NY
- Ilko Ilev, PhD, Office of Science and Engineering Laboratories, FDA, Bethesda, MD
- Jay Knutson, PhD, Laboratory of Molecular Biophysics, NHLBI, Bethesda, MD
- Ralph Nossal, PhD, Program in Physical Biology, NICHD, Bethesda, MD
- Sinisa Pajevic, PhD, Division of Computational Bioscience, CIT, NIH, Bethesda, MD
- Tom Pohida, MS, Division of Computational Bioscience, CIT, NIH, Bethesda, MD
- Dan Sackett, PhD, Program in Physical Biology, NICHD, Bethesda, MD
- Alexsandr Smirnov, PhD, Light Microscopy Facility, NHLBI, Bethesda, MD
- Paul Smith, PhD, Division of Bioengineering and Physical Science, Office of Research Services, NIH, Bethesda, MD
- Eric Wassermann, MD, Cognitive Neuroscience Section, NINDS, Bethesda, MD
- Robert Yarchoan, MD, HIV and AIDS Malignancy Branch, NCI, Bethesda, MD
- Rafal Zielinski, PhD, Radiation Oncology Branch, NCI, Bethesda, MD
Contact
For more information, email amir@helix.nih.gov.