

You are here: Home > Section on Eukaryotic Transposable Elements
Retrotransposons as Models for the Replication of Retroviruses

- Henry L. Levin, PhD, Head, Section on Eukaryotic Transposable Elements
- Angela Atwood-Moore, BA, Senior Research Assistant
- Atreyi Chatterjee, PhD, Visiting Fellow
- Caroline Esnault, PhD, Visiting Fellow
- Yabin Guo, PhD, Visiting Fellow
- Anusua Majumdar, PhD, Visiting Fellow
- Sudhir Rai, PhD, Visiting Fellow
- Parmit Singh, PhD, Visiting Fellow
- Gang Feng, BA, Graduate Student
- Stephen Hung, BA, Postbaccalaureate Fellow
- Elizabeth Humes, BA, Postbaccalaureate Fellow
- Yujin Cui, BA, Volunteer
Inherently mutagenic, the integration of retroviral and retrotransposon DNA is responsible for many pathologies, including malignancy. In particular, the integration of HIV-1 shows a significant preference for actively transcribed genes, a preference that is dependent on the host factor LEDGF (lens epithelium–derived growth factor). Similarly, the insertion of murine leukemia virus shows a strong preference for sites within 5 kb of transcription initiation. An understanding of the mechanisms responsible for targeted integration could lead to new approaches to block the replication of HIV-1. Given that the use of an murine leukemia virus (MLV)–based vector in infants with severe immunodeficiency resulted in integration events at a known protoncogene gene as well as the induction of leukemia in patients, another key motivation for the study of integration preferences is to improve the safety of retrovirus vectors used in gene therapy.
Determinants of the integration pattern of retrotransposon Tf1 in the fbp1 promoter of Schizosaccharomyces pombe
Click image to enlarge.
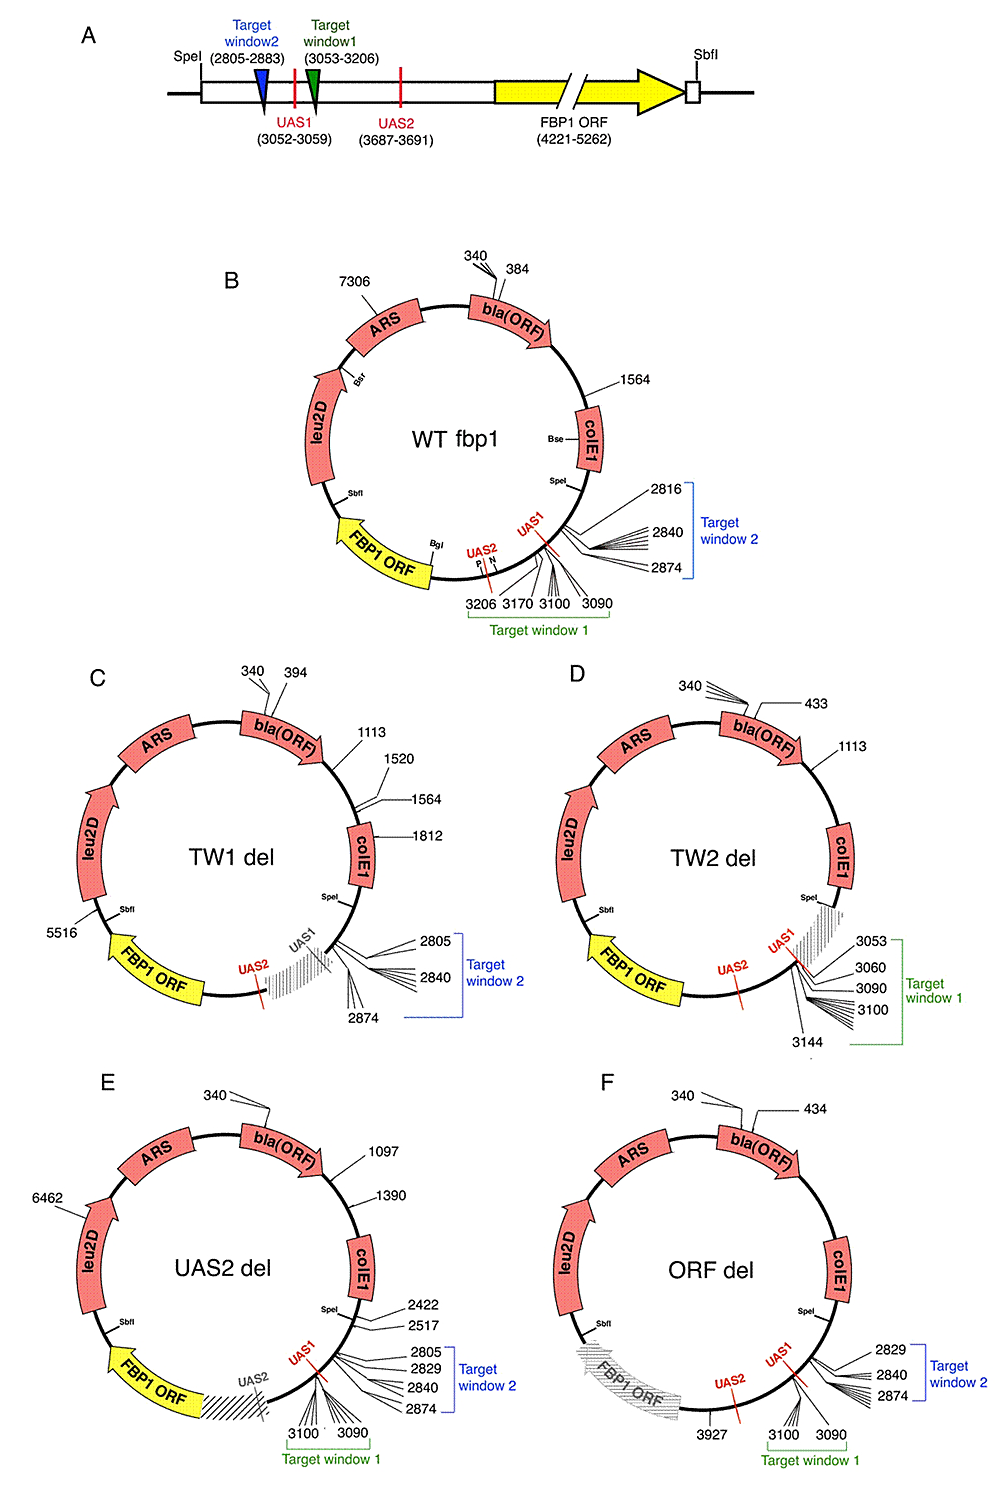
Figure 1. A plasmid-based assay for integration of Tf1 in fbp1
A. Linear diagram representing the fbp1 promoter in construct pHL2679. The construct has a 2.9 kb fbp1 sequence that includes UAS1 (in red), UAS2 (in red), and the fbp1 ORF (in yellow block arrow). Integration occurred in TW1 (green triangle) and TW2 (blue triangle). In parentheses are the coordinate numbers based on the WT fbp1 plasmid (pHL2679). The target plasmid assay was used to map integration in plasmids that contained WT fbp1(B), TW1 deleted (C), TW2 deleted (D), UAS2 deleted (E), and ORF deleted (F). The positions of integration events are shown as black lines with plasmid coordinate numbers based on the sequence of WT fbp1. The positions of TW1 and TW2 are shown for each plasmid. Restriction sites for BseYI (Bse), SpeI (SpeI), NgOMIV (N), PacI (P), BglII (Bgl), SbfI (SbfI), and BsrGI (Bsr) are shown.
A specific goal of our research is to identify the mechanism that directs integration to regions containing pol II promoters. To study insertion patterns in specific genes, we developed a target plasmid assay. Integration into the promoter of fbp1 clustered within 10 bp of a transcription enhancer called upstream activating sequence 1 (UAS1). Integration into the promoter of fbp1 depended on UAS1 sequence and Atf1p, a transcription activator that binds to UAS1. To identify the key determinants responsible for targeting integration in the fbp1 promoter, we conducted an extensive study of the promoter sequences (3). We found that two discrete target windows close to UAS1 were the only sequences in the promoter required for the pattern of integration (Figure 1). The two target windows functioned independently, with each sufficient to function as an efficient target of integration. Although Atf1p is necessary for directing integration to UAS1, it may be that, by activating transcription, Atf1p induces subsequent steps of transcription that are more directly responsible for directing integration. If the role of Atf1p in integration were indirect, other factors that promote fbp1 transcription would also influence integration at this promoter. However, other known factors that mediate fbp1 transcription—Pcr1p, Rst2p, and Tup11p/Tup12p—did not contribute to integration. UAS2 is an independent enhancer in the promoter offbp1 and not a target of integration. Nevertheless, we found that UAS2 did promote efficient transcription of fbp1. In addition, we found a synthetic promoter induced by lexA, fused to the activator VP16, was not a target of Tf1 integration. The data indicate that transcription activity of a promoter is not sufficient to mediate integration but that Atf1p plays a direct and specific role in targeting integration to UAS1 of the fbp1 promoter.
The integrase of Tf1 interacts directly with the b-ZIP domain of Pcr1p.
The role of Atf1p in integration may be to bind to and recruit integrase to UAS1. To test integrase for direct interactions with Atf1p, we conducted pull-down experiments, fusing various domains of integrase and Atf1p to epitope tags and purifyiing the recombinant proteins from bacteria. The experiments demonstrated that the catalytic core of integrase interacted with the b-ZIP domain of Atf1p. While the in vitro results with recombinant proteins indicated that integrase and Atf1p are capable of direct interaction, the experiment did not address whether the interactions occur within the cell. We therefore used the yeast two-hybrid assay and tested the domains of integrase and Atf1p for interactions. The two-hybrid assays detected the same interaction identified with the recombinant proteins, namely, the binding of the b-ZIP domain of Atf1p to the catalytic core of integrase. The results suggested that integration is directed to the promoter of fbp1 by the binding of integrase to Atf1p anchored at UAS1. Working with recombinant proteins and DNA, we identified a three-component complex. Gel retardation assays detected a complex that contained integrase, the b-ZIP domain, and a 100 bp DNA from fbp1 that included UAS1. We also conducted experiments to test whether the complex was capable of directing integration. We detected integration products within the 100 bp DNA that corresponded to the same positions of insertion that are selected in vivo. The data demonstrated that integration targeted to specific sites in the promoter of fbp1 was reconstituted with purified integrase, the b-ZIP domain of Atf1p, and a 100 bp DNA.
Ultra–high throughput sequencing of transposon integration provides a saturated profile of target activity in Schizosaccharomyces pombe.
The finding that integration in the genome of S. pombe is directed to the promoters of genes raises several important questions about the biology of Tf1 integration, namely, whether all promoters are recognized equally or whether integration is directed to specific sets of promoters. If specific sets of promoters are preferred targets, what distinguishes the preferred promoters from those not recognized by Tf1? To address this question, we sequenced large numbers of integrations throughout the genome of S. pombe (2). The revolutionary new methods for ultra–high throughput sequencing made it possible to characterize extraordinarily large numbers of integration events.
To select for the cells with integration events, we induced cells for the expression of Tf1–containing neo (Tf1–neo). We applied ligation-mediated PCR to generate libraries of Tf1–neo associated with the downstream flanking DNA. We performed four independent transposition experiments (Hap_Mse_1, Hap_Mse_2, Dip_Mse, and Dip_Hpy), which were named according to the strains (haploid or diploid) and restriction enzymes (Mse I or Hpy CH4 IV) used to digest the genomic DNA from the cells with integration events. We ligated the cut libraries of DNA to linkers and subjected them to barcoded PCR. The amplified products, consisting of the downstream long terminal repeats (LTRs) and their flanking DNA, were size selected and submitted to 454 Life Sciences for sequencing.
Altogether, we obtained 599,760 high-quality sequence reads, which we then analyzed with BLAST to determine the chromosomal location of the insertions. In all, there were 73,125 independent Tf1 integration events in unique positions of the S. pombe genome. The BLAST results of sequences from our first integration library identified 21,848 independent insertions in the experiment termed Hap_Mse_2. The insertions were broadly distributed across all three chromosomes. To examine the insertion data for preferences, we mapped all 21,848 insertion sites from the Hap_Mse_2 experiment relative to open reading frames (ORFs) and determined the distance from the insertions to the closest ORF. The integration from Hap_Mse_2 showed a clear preference for the first 500 nt upstream of ORFs.
The profile of integration across the genome revealed substantial variation, with some intervals containing 35 to 40 insertions per kb while many others had zero to five insertions per kb. An analysis of integration density for intervals of 10 kb also showed high levels of bias that were incompatible with random selection. The key question about this variation in integration is whether it could be attributed to intrinsic differences in integration efficiency between different sequences in the genome or whether the size of our cultures and the PCR amplification limited our ability to sample the integration potential of each sequence. To distinguish between these two possibilities, we tested whether the levels of integration in individual intergenic sequences were reproducible between several independent experiments. We compared the number of integration events in the intergenic regions of the Hap_Mse_2 experiment with the number of integration events from the Dip_Mse experiment. We plotted each intergenic region using the number of integration events identified in the Hap_Mse_2 experiment as the X coordinate and the number of inserts recorded in the Dip_Mse experiment as the Y coordinate. Given that each of the 5,045 intergenic regions was plotted and that many intergenic regions had the same X,Y coordinates, we used the Z coordinate to indicate the number of the intergenic regions with the same X,Y coordinates. The planar distribution of the data points showed that the level of integration in each intergenic region is similar between the two independent experiments. The R value for the data is 0.95 (R2=0.91), indicating a strong correlation of the integration levels between the two experiments. We performed the comparison between all pairs of the four experiments; the plots showed similar correlations.
In the Hap_Mse_2 experiment, 76% of all the insertion events occurred in just 20% of the intergenic sequences. The strong bias is a consequence of the integration preference for a specific set of promoters. One possible explanation is that Tf1 integrated into the promoters with the highest transcription activity. We tested this hypothesis but found no correlation between transcription and integration. In another effort to determine what distinguishes promoters with high levels of insertions from promoters without such levels, we investigated whether the genes associated with the targeted promoters contribute to specific classes of biological function. The results of the gene ontology analysis suggested that genes regulated by environmental stress are among the strongest targets of integration. To examine this phenomenon further, we sorted all the intergenic sequences from the highest number of insertions to the lowest, using the Hap_Mse_2 data, and placed the intergenic regions into bins of 500 each. We then used published microarray data to tabulate how many of the intergenic regions in each bin contained promoters that are induced at least three-fold by stress conditions. The bin containing the 500 intergenic regions with the most integration contained the highest number of genes induced by cadmium. The bins with successively lower amounts of integration contained fewer promoters induced by cadmium. This relationship indicates that integration has a preference for promoters induced by cadmium. We observed similar preferences for genes that were induced when cells are treated with hydrogen peroxide or heat. For the first bin of 500 intergenic regions, we also observed particularly strong preferences for integration into promoters induced by methyl methanesulfonate or sorbitol. The targeting of Tf1 to stress-induced promoters represents a unique response that may specifically function to alter expression levels of stress-response genes. Despite a lack of systematic data, integration of Tf1 into the promoter of ade6 and bub1 does stimulate transcription.
The size and number of the integration experiments resulted in reproducible measures of integration for each intergenic region and ORF in the S. pombe genome. The reproducibility of the integration activity of each intergenic and ORF sequence from experiment to experiment demonstrates that we have saturated the full set of insertion sites actively targeted by Tf1. To our knowledge, this is the first time such a profile of integration data has been assembled.
Integration profiling: a whole-genome analysis of sequence function
(click to enlarge)
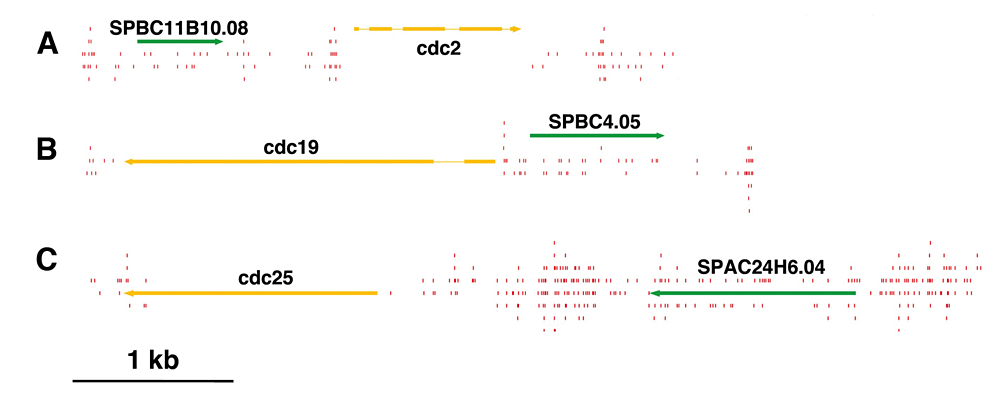
Figure 2. Essential genes contained low numbers of integration events.
Few insertions (red lines) occurred in essential genes such as the cdc genes (yellow) compared with nonessential genes (green).
The existing genome-wide methods for testing gene function consist largely of microarray hybridization and deep sequencing of RNA, techniques that infer function based on patterns of gene expression. Despite the valuable information produced by these methods, they do not provide a direct demonstration of gene function. To address this need, we developed integration profiling—a simple method capable of directly probing the function of the single-copy sequences throughout the genome of a haploid eukaryote. With transposons that readily disrupt ORFs and sequencing technology that can position over 30 million insertions per reaction, the analysis of a single culture can identify which sequences in a eukaryotic genome are functional. In previous work, we found that the "cut and paste" DNA transposon Hermes from the housefly is highly active in S. pombe. The high rate of integration and the disruption of ORFs means that Hermes is suitable for mutagenesis studies. With integration profiling, large populations of cells with transposon insertions are grown for many generations, depleting the culture of cells that have insertions in genes important for division. In one experiment, we passaged cells for 74 generations until 13.4% of the cells in the final culture contained an integrated copy of Hermes. We determined the positions of the insertions in the culture by ligation-mediate PCR followed by Illumina sequencing. We identified 360,000 unique insertion events that produced an average of one insertion for every 29 bp of the S. pombe genome. A survey of known essential genes revealed very few insertions per ORF while neighboring nonessential gene ORFs had high numbers of insertions (Figure 2). Recently, a consortium systematically deleted the ORFs of S. pombe in heterozygous diploids and, after sporulation, designated which ORFs were essential (Kim et al., Nat Biotechnol 2010;28:617). Using these designations, we plotted the distribution of integration densities separately for the nonessential and essential ORFs. We also graphed the integration densities of a subclass of nonessential genes that, when deleted, resulted in small colonies. Clearly, the essential ORFs had significantly fewer insertions/kb than the nonessential ORFs, indicating that the integration profiles did discriminate between essential and nonessential ORFs. Importantly, the nonessential ORFs required for full colony growth had intermediate densities of integration, indicating that intermediate levels of integration may be used to identify nonessential genes that nevertheless contribute to growth. The principal discrepancy between the designations made by the consortium and the Hermes integration is the group of 200 ORFs designated nonessential, which exhibited very low levels of integration. Using PCR and DNA blotting, we found that the majority of these consortium designations were incorrect because the genes had not been successfully deleted. The results validate integration profiling as an accurate method for measuring gene function.
Additional Funding
- NIH Intramural AIDS Targeted Antiviral Program (2010 and 2011)
Publications
- Chatterjee AG, Leem Y, Kelly F, Levin H. The chromodomain of Tf1 integrase promotes binding to cDNA and mediates target site selection. J Virol 2009;83:2675-2685.
- Guo Y, Levin H. High throughput sequencing of retrotransposon integration provides a saturated profile of target activity in Schizosaccharomyces pombe. Genome Res 2010;20:239-248.
- Majumdar A, Chatterjee A, Ripmaster T, Levin H. The determinants that specify the integration pattern of retrotransposon Tf1 in the fbp1 promoter of Schizosaccharomyces pombe. J Virol 2011;85:519-529.
- Levin H, Moran J. Dynamic interactions between transposable elements and their hosts. Nat Rev Genet 2011;12:615-627.
- Rhind N, Chen Z, Yassour M, Thompson DA, Haas BJ, Habib N, Wapinski I, Roy S, Lin MF, Heiman DI, Young SK, Furuya K, Guo Y, Pidoux A, Chen HM, Robbertse B, Goldberg JM, Aoki K, Bayne EH, Berlin AM, Desjardins CA, Dobbs E, Dukaj L, Fan L, FitzGerald MG, French C, Gujja S, Hansen K, Keifenheim D, Levin JZ, Mosher RA, Müller CA, Pfiffner J, Priest M, Russ C, Smialowska A, Swoboda P, Sykes SM, Vaughn M, Vengrova S, Yoder R, Zeng Q, Allshire R, Baulcombe D, Birren BW, Brown W, Ekwall K, Kellis M, Leatherwood J, Levin H, Margalit H, Martienssen R, Nieduszynski CA, Spatafora JW, Friedman N, Dalgaard JZ, Baumann P, Niki H, Regev A, Nusbaum C. Comparative functional genomics of the fission yeasts. Science 2011;332:930-936.
Collaborators
- Shiv Grewel, PhD, Laboratory of Biochemistry and Molecular Biology, NCI, Bethesda, MD
Contact
For more information, email henry_levin@nih.gov or visit sete.nichd.nih.gov.