Quantitative Biophotonics for Tissue Characterization and Function
- Amir H. Gandjbakhche, PhD, Head, Section on Analytical and Functional Biophotonics
- Victor Chernomordik, PhD, Staff Scientist
- Fatima A. Chowdhry, MD, Research Fellow
- Afrouz Anderson, PhD, Postdoctoral Fellow
- Elizabeth Smith, PhD, Postdoctoral Fellow
- Nader Shahni Karamzadeh, PhD, Data Scientist (Contractor)
- Ali Afshari, MS, Predoctoral Student
- Hadis Dashtestani, MS, Predoctoral Student
- Riley Kermanian, BS, Postbaccalaureate Fellow
- Rachel Zaragoza, BS, Postbaccalaureate Fellow
- Maryam Ghasemi Ghonchehnazi, MSc, Special Volunteer
- Elahe Shafiei Haghshenas, MSc, Special Volunteer
- Franck Amyot, PhD, Guest Researcher
- Siamak Aram, PhD, Guest Researcher
- Yasaman Ardeshirpour, PhD, Guest Researcher
- Bahar Dasgeb, MD, Guest Researcher
- Jana Kainerstorfer, PhD, Guest Researcher
Our general goal is to devise quantitative methodologies and associated instrumentation to bring technologies from the bench to bedside. We select our projects in the framework of the mission of the NICHD, focusing on childhood and adolescent disorders, as well as abnormal developments of cells such as occur in cancer. We operate in the so-called 4B research mode: (1) at the Blackboard—modeling the methodologies, (2) at the Bench—designing the prototypes to be brought to the Bedside, (3) at the Bedside—piloting clinical protocols, and (4) Back to the BlackBoard—improving the systems/methodologies.
Structural and functional brain imaging
Functional near-infrared spectroscopy (fNIRS) is an emerging non-invasive imaging technique to assess brain function. The technique is portable and therefore applicable in studies of children and toddlers, especially those with neuro-developmental disorders. fNIRS measurements are based on the local changes in cerebral hemodynamic levels (oxy-hemoglobin and deoxy-hemoglobin) associated with brain activity, similar to BOLD (blood-oxygen-level dependent contrast imaging) fMRI. Given the low optical absorption of biological tissues at near infrared (NIR) wavelengths (700–900 nm), NIR light can penetrate deep enough to probe cortical regions up to 1–3 cm deep. Furthermore, the NIR absorption spectrum (NIRS) of the tissue is sensitive to changes in the concentration of major tissue chromophores such as hemoglobin, so that measurements of temporal variations of backscattered light can capture functionally evoked changes in the outermost cortex and used to assess the brain function. However, there is a need to address the changes in NIRS signal related to underlying physiological processes in the brain such as cerebral autoregulation (CA). In short, CA maintains blood flow over the range of arterial blood pressure and, owing to the high metabolic demand of neurons, becomes a vital process for a brain function. Devising a novel method of data processing to enrich the informational content of measured characteristics from fNIRS is therefore crucial for further studies of brain function and development.
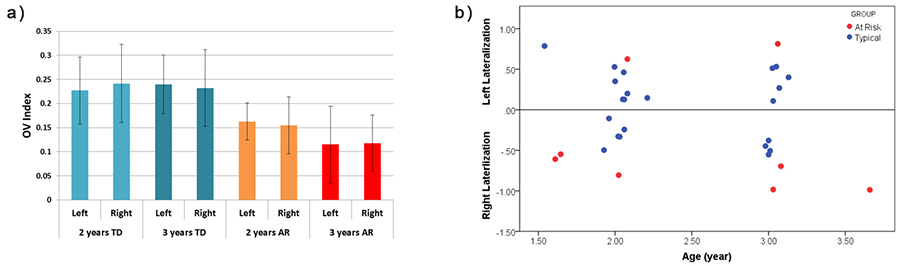
In a pilot study, we evaluated the utility of fNIRS in measuring cerebral hemodynamics in the prefrontal cortex (PFC) in toddlers between 18 and 36 months of age. Further, we analyzed group differences in fNIRS data gathered during a 'vanilla' baseline period (such as watching a calming video) in toddlers with typical development delay and a group of children at risk for developmental delay. The analysis includes assessment of the hemodynamic activation, based on changes in oxy-hemoglobin, in the left and right PFC, and the oxygenation variability (OV) index based on variability in oxygen saturation at frequencies attributed to CA for each child. In our pilot study we found that at-risk (AR) participants showed preliminary evidence for both more right-sided activation and higher differences between left and right activation than in the typical development (TD) group (Figure 1B). In addition, AR toddlers had a significantly lower overall OV index than TD children in both the left and right PFC (Figure 1A). It is worth mentioning that the OV index is not a direct measure of CA. Rather, the OV index is associated with frequencies related to this mechanism and serves to quantify oscillations in those frequencies. While this study suggests that some features of prefrontal hemodynamics may vary in toddlers at risk for developmental delays owing to early language delay, more research in this age group is required to clarify the specificity of these differences. These preliminary findings show the feasibility of using fNIRS in typical toddlers and those with delayed development and in doing so support future studies in larger samples.
Click image to enlarge.
Figure 1.
(A) OV index values from left and right prefrontal cortex in TD and AR subjects with TD subjects exhibiting a higher OV index. The error bar is based on the standard deviation. (B) Percent difference between left and right activation for each subject. Negative values indicate right lateralization while positive values show left lateralization. Higher values in the positive and negative direction indicate the greater activation in left or right PFC, respectively.
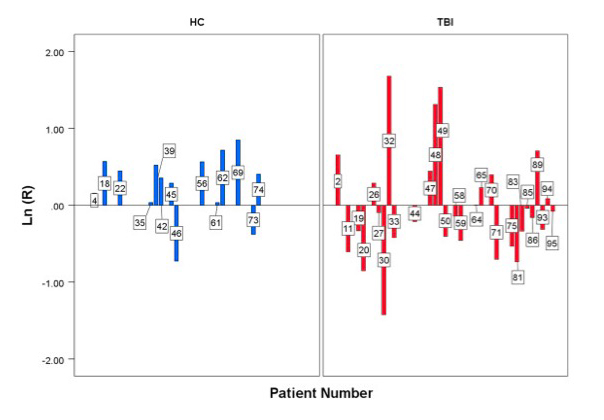
In another study involving a group of healthy controls (HC) and a traumatic brain injury (TBI) population, low frequency oscillations in the hemodynamic signal were assessed using the OV Index, which were obtained from the oxy/deoxy-hemoglobin variations in response to an action complexity judgment task. The task produced a varying cognitive load that led to activation of the brain, more so the anterior and medial region than the dorsolateral prefrontal cortex. These regions in the brain show a more intense hemodynamic response during a working memory task. The HC and the TBI group had to evaluate the complexity of daily life activities by classifying the number of steps within the task as being “few” or “many,” which are further divided into high and low complexity tasks. Within the HC group, there was a strong parametric effect with regard to the mean OV indices that corresponded to the high complexity tasks, which were higher than that of the low complexity tasks. We computed the ratio of OV indices for high complexity and low complexity loads for each subject. Our results show that this ratio is significantly higher for the HC group than for the TBI group. This means that, for the TBI group, brain activation does not change significantly between high- and low-complexity loads, in contrast to the HC group, and shows that OV index metrics can be sensitive when applied to chronic TBI and potentially used to separate subpopulations of TBI from HC (Figure 2).
Click image to enlarge.
Figure 2.
Individual subject ratio (R), on a logarithm scale, of the OV indexes between high- and low-complexity load tasks in 14 HC (healthy control) patients (blue) and 29 traumatic brain injury (TBI) patients (red). The ratio for each individual shows an increase of OV index in the HC group between the two loads but not in the TBI group.
Moreover, we explored the potential prefrontal hemodynamic biomarkers to characterize subjects with TBI by employing a multivariate machine-learning approach and introducing a novel task-related hemodynamic response detection followed by a heuristic search for optimum set of hemodynamic features. To achieve this goal, the hemodynamic response from a group of 31 healthy controls and 30 chronic TBI subjects were recorded as they performed a complexity task. To determine the optimum hemodynamic features, we considered 11 features and their combinations in characterizing TBI subjects. We investigated the significance of the features by using a machine-learning classification algorithm to score all the possible combinations of features according to their predictive power. The identified optimum feature elements resulted in classification accuracy, sensitivity, and specificity of 85%, 85%, and 84%, respectively. Classification improvement was achieved for TBI subject classification through feature combination. It signified the major advantage of the multivariate analysis over the commonly used univariate analysis, suggesting that the features that are individually irrelevant in characterizing the data may become relevant when used in combination. We also conducted a spatio-temporal classification to identify regions within the PFC that contribute to distinguishing between TBI and healthy subjects. As expected, Brodmann area 10 (BA10) within the PFC was the only region in which healthy subjects, unlike subjects with TBI, showed major hemodynamic activity in response to the High Complexity task. Overall, our results indicate that identified temporal and spatio-temporal features from PFC's hemodynamic activity are promising biomarkers in classifying subjects with TBI (Figure 3).
Click image to enlarge.
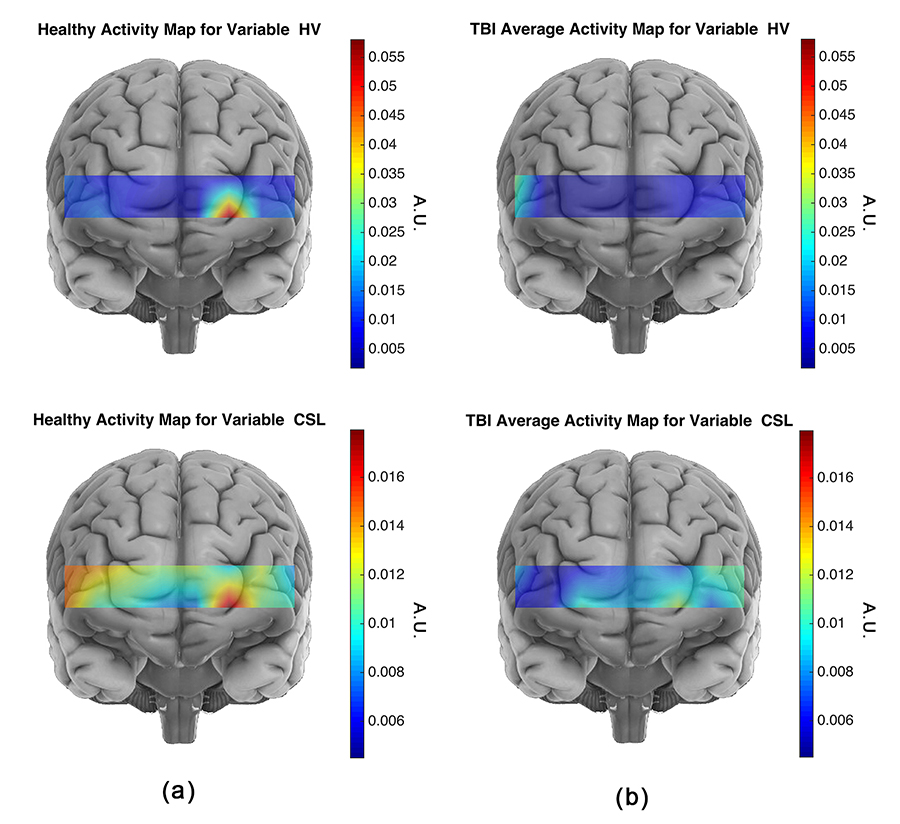
Figure 3. Average activity maps for the CSL and HV features for the healthy (a) and TBI (b) subjects
The activity map for a spatio-temporal feature associated with a population is obtained by averaging every subject's (from the corresponding population) spatio-temporal feature set. For the TBI population, the larger HbO variance (HV) values are located at several locations, with largest on the right hemisphere, whereas for the healthy population the largest HV is concentrated on the left hemisphere of Brodmann area 10 (BA10). Furthermore, on average healthy subjects show larger HV values for the HbO signal, which indicates that the oxygenation signal shows higher variation in the healthy subjects. The HbO signal in response to the high-complexity task for the healthy subjects shows larger variation and is spatially less diffuse than for the TBI subjects. Larger activity CSL (curve slope left) values correspond to a faster rate of oxygenation consumption. Considering the activity map for healthy subjects, the largest CSL values cover the left frontopolar of the BA10. A comparison of healthy and TBI subjects’ CSL activity map reveals that healthy subjects show higher oxygenation consumption rate in response to the high-complexity task at all the sites of fNIRS data collection.
Multispectral imaging
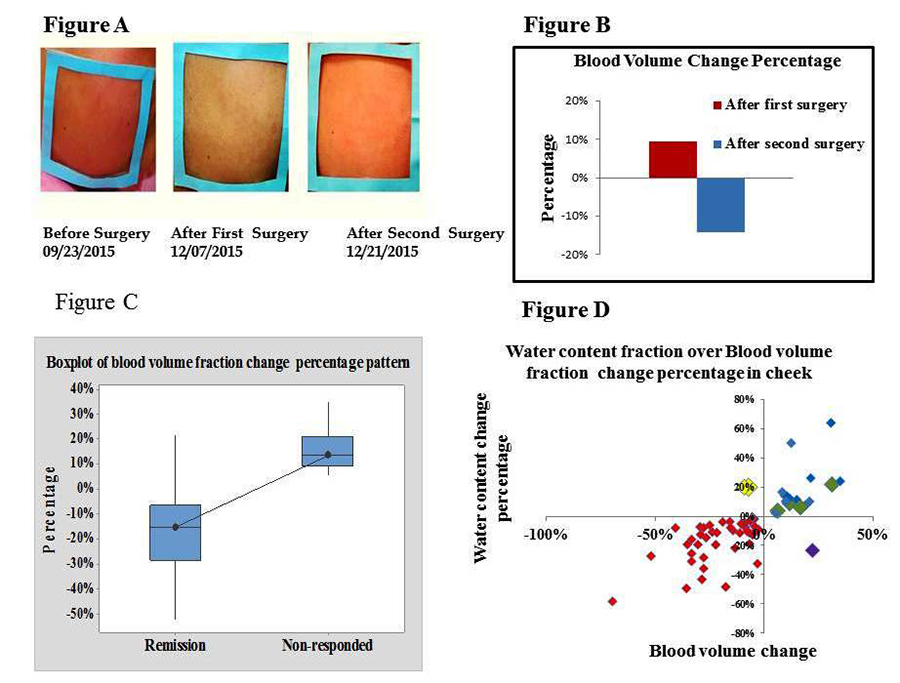
Facial plethora is one of the earliest described clinical features of Cushing's syndrome (CS). In collaboration with the Section on Genetics and Endocrinology, we continued a study aimed at quantifying changes of facial plethora in CS as an early assessment of treatment efficacy. Cushing’s patients are recruited for multi-spectral imaging, before and after surgery with follow-up sessions 6 months to two years after surgery. To date, of the 69 subjects enrolled in our study, 57 were recognized to be eligible for the processing stage. Four required two consecutive surgeries, as the initial trans-sphenoidal surgery (TSS) was unsuccessful. So far, we were able to reconstruct the biological parameters of 61 subjects. Among these, 44 patients had adrenocorticotropic hormone (ACTH)–secreting pituitary tumors-Cushing's disease (CD), 14 had ACTH–independent adrenocortical tumors and three had an ectopic ACTH–secreting pulmonary carcinoid. Non-invasive multi-spectral near-infrared imaging was performed on the right cheek of the patients before and two days or up to two weeks after surgery. Patients were defined as cured by post-operative plasma cortisol of less than 3 mcg/dl and/or adrenocortical insufficiency for which they received replacement. Clinical data, obtained from the 57 patients, indicate that a decrease in facial plethora after surgery, as evidenced by decrease in blood volume fraction, is well correlated with cure of CS (Reference 3).
We recently explored the same trend by studying the water content fraction. Our new finding shows that water content fraction could also quantify facial plethora as a biomarker of early cure in patients with CS. We observed that the fraction of the cheek’s water content, measured with the multi-spectral system, could be used to differentiate cured and non-cured CS patients within a short time after surgical treatment (Figure 4). The findings for both blood volume and water content fractions are significantly correlated, but it seems blood volume is better associated with clinical evaluations. The number of false-negatives in water content analysis was slightly higher. Application of this novel technology in follow up data was realized and we obtained successful results; the methodology and analytic algorithm is applied during the first and second post-surgery follow up. First follow up is usually between 3-6 months after surgery and second follow six months after first follow up. We have processed data for 22 imaged patients in first follow up and 10 in second follow up. They were identified clinically in remission state by last visit. The results confirmed our hypothesis that patients who were assessed as cured, based on significant drop in their cortisol level after the surgery, retained a lower blood volume fraction in the region of interest than before surgical treatment, also in follow up sessions. The next step is to develop an improved multi-spectral system for CS that will consist of imaging capabilities at several wavelengths.
Click image to enlarge.
Figure 4.
A. Facial plethora in a patient with CD before trans-sphenoidal surgery (TSS), after the first TSS (non-cured), and after the second TSS (cured). B. The blood volume fraction percentage change of the patient's right cheek associated with Figure A at different imaging sessions underscores the advantage of the method over visual inspection. C. Boxplot of medium percentage change indicating change in blood volume after surgery, compared with before surgery, in each of the remission and non-responding groups of Cushing's patients. The distribution shows median confidence interval box and interquartile range. D. Correlation of percentage change in blood volume and water content fractions of right cheek side of 57 CD patients who received surgical treatment.
We are pursuing Kaposi Sarcoma (KS) studies in ongoing clinical trials under four different NCI protocols and therapeutic agents. We observed additional patients and will apply a new classification system in the processing stage that will result in a proof of capability of our novel technology as a robust device and additional tool for the medical community. In ongoing analyses of the data, the goal is to further evaluate diffuse multi-spectral imaging in a relatively large sample as a potential supplement to existing response assessment in KS, providing an early non-invasive marker of treatment efficacy.
Fluorescence methods in pre-clinical studies of HER2–positive breast cancer and of basal cell carcinoma expressing BerEP4
HER2–specific fluorescently labeled probes:
We studied the potential of in vivo fluorescence lifetime imaging to monitor the efficacy of treatment, in particular the feasibility of fluorescence lifetime imaging to monitor in vivo expression of the HER2 receptor in a breast carcinoma (mouse model) during the course of treatment. We observed a considerable difference between the fluorescence lifetime of HER2–specific optical probes at the tumor and a contra-lateral site before and seven days after the last treatment with 17-DMAG (an HSP90 inhibitor), when the tumor regrew to almost its pretreatment volume. However, soon after the therapy (12 hours), when the effect of drug on HER2 degradation is maximal, the difference was significantly smaller. Based on our previous findings on the relationship between fluorescence lifetime and binding of a HER2–specific probe to corresponding receptors, we believe that the differences between the fluorescence lifetimes at the tumor and contralateral site, observed for mice with BT-474 xenografts after treatment with 17-DMAG, results from the strong downregulation of HER2 receptors soon after the therapy (i.e., fewer binding sites for the HER2–specific probe) and corresponding changes in the fraction of bound to total fluorescent probes in the tumor. Immediately after treatment, the fraction of bound to total fluorophores inside the tumor changed considerably, resulting in a noticeable increase in the average fluorescence lifetime. Subsequent tumor and HER2 expression recovery a week later caused gradual restoration of the original level of the binding ratio of HER2–targeting probe in the tumor and a corresponding return to pre-treatment values of the fluorescence lifetime. The results reveal that fluorescence lifetime imaging, based on evaluating the fraction of the bound and unbound fluorophores inside the tumor, can be used as an alternative in vivo imaging approach to characterize tumors, separate high from low HER2–expression tumors, and monitor the efficacy of targeted therapies.
Molecular biomarkers for basal cell carcinoma (BCC) for use in its diagnosis, treatment, and follow up
We conducted a pilot study to determine the affinity and selectivity of the BerEp4 antibody conjugated with a fluorescence probe and to assess its possible use in designing theranostic probes for BCC. BCC appears macroscopically and microscopically similar to many other skin lesions, which makes differential diagnosis difficult. Based on initial cell culture results, BerEP4 appears to be a promising biomarker for molecular imaging of BCC and can be used in conjunction with in vivo near-infrared fluorescence imaging. To prepare BerEP4 for eventual theranostic use, we examined the feasibility of a combined macro-/micro-optical approach to imaging BCC with various histologies. During an in vitro phase, we showed specificity and selectivity of the BerEP4 antibody to target EpCAM on live cells. EpCAM is an ideal biomarker to target BCC because it is expressed in more than 95% of human BCC. In the subsequent in vivo phase, using xenograft mouse models, we reproduced persisting in vivo specificity and selectivity of the BerEP4 antibody to detect EpCAM–expressing xenograft tumors, when injected systemically via tail veins. Moving forward, we plan to: (1) modify our antibody to a smaller molecule—a stable aptamer or single-strand antibody—to facilitate topical delivery (instead of systemic) for skin cancer; (2) repeat the in vivo experiment to show reproducible results with modified and smaller probe; this phase would encompass initial systemic injection of the probe followed by experiments to test how best to achieve topical delivery, including micro-injection; (3) once in vivo non-invasive targeting of BCC is achieved via topical introduction, to further engineer our diagnostic probe to be photo-sensitized to achieve photodynamic treatment at the time of diagnosis.
Real-time oximetry of anterior placenta using near infrared spectroscopy
Monitoring placental oxygenation and the vascular network binding the expectant mother to the fetus is critical to ensure a healthy pregnancy outcome. In the third conference on the Human Placenta Project held at NIH in April, 2016, it was acknowledged that the quantification of placental oxygenation could play a vital role in both maternal and fetal health during pregnancy. Reduced utero-placental perfusion has been associated with preeclampsia and intrauterine growth restriction, and reduced oxygenation can lead to fetal hypoxia, asphyxia, and cerebral palsy. However, there are instances where higher oxygenation at the intervillous space during pregnancy has been associated with abnormal placental function. But there are no patient-friendly devices to measure the oxygenation of the placenta. One of the challenges identified at the conference was the lack of a baseline for normal placental oxygenation. Therefore, it is of fundamental importance to have a quantitative understanding of placental oxygenation to detect any abnormality (i.e., increase or decrease) relative to normal placental function. With its wearable, wireless capability convenient for dynamic monitoring, fNIRS provides a technique that can address these challenges. Through the Human Placenta Project, we intend to (1) find the baseline for the normal vs. abnormal pregnancies and standardize the oxygenation data across pregnancies and (2) correlate the oxygenation data with the pregnancy outcomes.
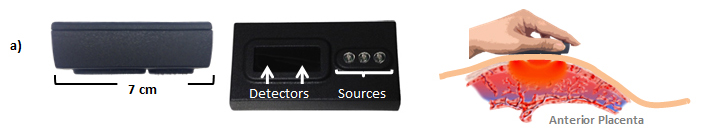
We have accomplished the first critical phase of this project at the bench. We now have a fast, non-invasive, wearable device with wireless capability that allow continuous measurement of the oxygenation of the anterior placenta in a subject-friendly environment. This compact system, only weighting 1.4 ounces, can be positioned at different abdominal locations for efficient and localized measurement of oxygenation. In detail, the device consists of two detectors and three sources (Figure 5). Given that the probing depth of NIRS depends on the source detector separation, we devised the system to interrogate at different depths. This would provide us with information about different tissue types and permit us to distinguish between maternal and placental tissue. The NIRS device uses light in the near-infrared region at two wavelengths (760 and 850 nm), which are sensitive to changes in oxy-hemoglobin and deoxy-hemoglobin. Light enters the tissue at the location of source, and back scattered light is detected at the detector site. For patient safety, light intensities are within FDA requirements for Class I devices (less than 100 mW). The multiple-source detector design will allow probing of different vascular compartments of the uterus. By adding frequency filtering related to the pulsation of maternal tissue, we expect to separate the hemodynamics of the placenta from that of maternal tissue.
Click image to enlarge.
Figure 5.
Left panels. NIRS device and its schematic for placenta oxygenation measurement. Right panel. The device allows probing of different placental/maternal tissue depth.
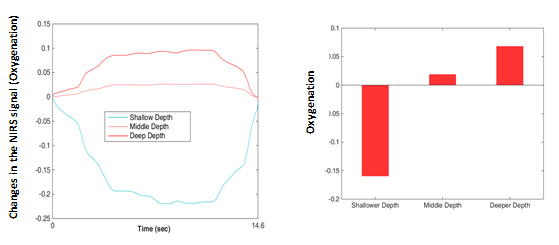
Using a similar approach, we were able to create a new index, the oxygenation variability index (OVI), which is correlated with CA. The index can be seen as the coefficient of variation of instantaneous oxygen saturation in frequency band directly related to the blood autoregulation. The pertinence of this quantitative parameter has been tested in brain activation in children (age 4-8). We tested the performance of the device on a static phantom that mimics the optical properties of uterine and placental tissue. The first layer (shallower region, thickness of 1cm) was designed to have very low absorption, whereas the second layer (deeper region, thickness of 3 cm) had much higher absorption. Using the device, we were able to distinguish between the layers and interrogate at different depth levels. Figure 6 shows an example of the initial analysis on our prototype phantom, where the deeper layer shows higher oxygenation than the shallower regions.
Click image to enlarge.
Figure 6.
Oxygenation measurement using a two-layer phantom, simulating maternal and placental tissue.
Our general strategy is to monitor the oxygenation of the placenta dynamically. Therefore we propose to use state-of-the-art 3D printing to simulate a dynamic placenta model. The 3D model will mimic both structural and functional aspects of the placenta and maternal tissue and provide more in-depth analysis of the NIRS signal regarding the changes in oxygenation of the placenta. Shad Deering will guide us in our clinical studies. Through this collaboration, we expect to test our device through a clinical protocol for a pilot study. Being able to separate maternal tissue oxygenation from placental oxygenation involves refining our data analysis software by incorporating anatomical localization and standardizing it across pregnancy. The outcome of this study might help provide earlier detection of pregnancy complications and thus improve both maternal and fetal health.
Additional Funding
- Bench to Bedside Award 345 (2016): “Mirror neuron network dysfunction as an early biomarker of neurodevelopment” (Ongoing)
- Human Placenta Project-NICHD (2016) (Ongoing)
Publications
- Karamzadeh N, Amyot F, Kenney K, Anderson A, Chowdhry F, Dashtestani H, Wassermann EM, Chernomordik V, Boccara C, Wegman E, Diaz-Arrastia R, Gandjbakhche AH. A machine learning approach to identify functional biomarkers in human prefrontal cortex for individuals with traumatic brain injury using functional near-infrared spectroscopy. Brain Behav 2016;1-14.
- Chernomordik V, Amyot F, Kenney K, Wassermann E, Diaz-Arrastia R, Gandjbakhche A. Abnormality of low frequency cerebral hemodynamics oscillations in TBI population. Brain Res 2016;1639:194-199.
- Afshari A, Ardeshirpour Y, Lodish MB, Gourgari E, Sinaii N, Keil M, Belyavskaya E, Lyssikatos C, Chowdhry FA, Chernomordik V, Anderson AA, Mazzuchi TA, Gandjbakhche A, Stratakis CA. Facial plethora: modern technology for quantifying an ancient clinical sign and its use in Cushing syndrome. J Clin Endocrinol Metab 2015;3928-3933.
- Karamzadeh N, Ardeshirpour Y, Kellman M, Chowdhry F, Anderson A, Chorlian D, Wegman E, Gandjbakhche A. Relative brain signature: a population-based feature extraction procedure to identify functional biomarkers in the brain of alcoholics. Brain Behav 2015;e00335.
- Amyot F, Arciniegas DB, Brazaitis MP, Curley KC, Diaz-Arrastia R, Gandjbakhche A, Herscovitch P, Hinds SR 2nd, Manley GT, Pacifico A, Razumovsky A, Riley J, Salzer W, Shih R, Smirniotopoulos JG, Stocker D. A review of the effectiveness of neuroimaging modalities for the detection of traumatic brain injury. J Neurotrauma 2015;32(22):1693-1721.
Collaborators
- Samuel Achilefu, PhD, Washington University School of Medicine, St. Louis, MO
- Claude Boccara, PhD, École Supérieure de Physique et de Chimie Industrielles, Paris, France
- Shad Deering, MD, Uniformed Services University of the Health Sciences, Bethesda, MD
- Stavros Demos, PhD, Lawrence Livermore National Laboratory, Livermore, CA
- Ramon Diaz-Arrastia, MD, PhD, Center for Neuroscience and Regenerative Medicine, Uniformed Services University of the Health Sciences, Bethesda, MD
- Israel Gannot, PhD, Tel Aviv University, Tel Aviv, Israel, and The George Washington University, Washington, DC
- Jay Knutson, PhD, Laboratory of Molecular Biophysics, NHLBI, Bethesda, MD
- Maya Lodish, MD, Pediatric Endocrinology Training Program, NICHD, Bethesda, MD
- Tom Pohida, MS, Division of Computational Bioscience, Center for Information Technology, NIH, Bethesda, MD
- Randall Pursley, Signal Processing and Instrumentation Section, Center for Information Technology, NIH, Bethesda, MD
- Dan Sackett, PhD, Section on Cell Biophysics, NICHD, Bethesda, MD
- Babak Shadgan, MD, MSc, PhD, University of British Columbia, Vancouver, Canada
- Constantine Stratakis, MD, D(med)Sci, Section on Endocrinology and Genetics, NICHD, Bethesda, MD
- Audrey Thurm, PhD, Pediatrics & Developmental Neuropsychiatry Branch, NIMH, Bethesda, MD
- Eric Wassermann, MD, Cognitive Neuroscience Section, NINDS, Bethesda, MD
- Robert Yarchoan, MD, HIV and AIDS Malignancy Branch, NCI, Bethesda, MD
Contact
For more information, email amir@helix.nih.gov or visit http://safb.nichd.nih.gov.