Quantitative Biophotonics for Tissue Characterization and Function

- Amir H. Gandjbakhche, PhD, Head, Section on Analytical and Functional Biophotonics
- Victor Chernomordik, PhD, Staff Scientist
- Fatima A. Chowdhry, MD, Research Fellow
- Yasaman Ardeshirpour, PhD, Postdoctoral Fellow
- Afrouz Azari, PhD, Postdoctoral Fellow
- Ali Afshari, MS, Predoctoral Student
- Hadis Dashtestani, MS, Predoctoral Student
- Nader Shahni Karamzadeh, MS, Predoctoral Student
- Franck Amyot, PhD, Guest Researcher
- Siamak Aram, PhD, Guest Researcher
- Bahar Dasgeb, MD, Guest Researcher
- Jana Kainerstorfer, PhD, Guest Researcher
- Alexander Sviridov, PhD, Guest Researcher
Our general goal is to devise quantitative methodologies and associated instrumentation to bring technology from the bench to bedside. We select our projects in the framework of the mission of the NICHD, focusing on childhood and adolescent disorders, as well as abnormal developments of cells such as occur in cancer. We operate in the so-called 4B research mode: at the Blackboard, one models the methodology; at the Bench, one designs the prototype to be brought to the Bedside; at this stage one goes Back to the Blackboard for improving the imaging system.
Structural and functional brain imaging
Functional near-infrared spectroscopy (fNIRS) is an emerging non-invasive imaging technique to assess the brain function. The technique is also portable and therefore applicable in studies of children and toddlers, especially those with neurodevelopmental disorders. fNIRS measurements are based on the local changes in cerebral hemodynamic levels (oxy-hemoglobin and deoxy-hemoglobin) associated with brain activity. Given the low optical absorption of biological tissues at NIR wavelengths (700–900 nm), NIR light can penetrate deep enough to probe cortical regions up to 1–3 cm deep. Furthermore, the NIR absorption spectrum of the tissue is sensitive to changes in the concentration of major tissue chromophores such as hemoglobin, so that measurements of temporal variations of backscattered light can capture functionally evoked changes in the outermost cortex and can be used to assess the brain function. However, there is a need to address the changes in NIRS signal related to underlying physiological processes in the brain such as cerebral autoregulation (CA). In short, the mechanism of CA maintains blood flow over the range of arterial blood pressure and, owing to the high metabolic demand of neurons, becomes a vital process for a brain function. Devising a novel method of data processing to enrich informational content of measured characteristics from fNIRS is therefore crucial for further studies of brain function and development.
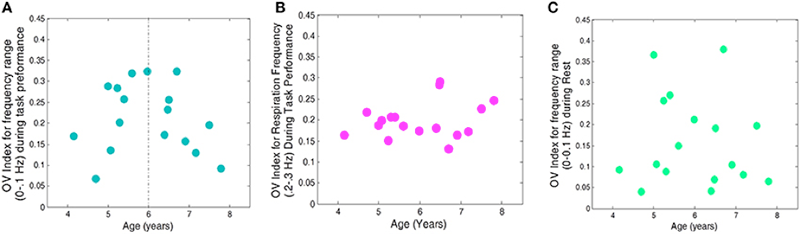
In one of our current studies, we use frequency analysis of oscillatory patterns from fNIRS to formulate a new metric of variations in local oxygen saturation. To characterize this metric, we introduce an Oxygen Variability Index (OV Index) and analyze two frequency bands (less than 0.1 Hz and 0.2–0.3 Hz). We then examined the relationship between OV Index in the two bands and age in a group of normally developing children. We hypothesize that the OV index, measured with the non-invasive and patient-friendly fNIRS modality, will reveal differences based on chronological age as seen in the extant literature on cerebral hemodynamics in children. We first investigated the relationship between age and OV Index, for frequencies of less than 0.1 Hz, across the Go, No-Go, and rest conditions and found a significant quadratic relationship for frequencies of less than 0.1 Hz, across task. We investigated both linear and nonlinear trends for the respiration frequencies (0.2–0.3 Hz) and found no significant change of OV index with age. The OV index values were higher for frequencies of less than 0.1 Hz, for GO/No-Go Task conditions when compared with rest. The finding is in line with those showing increases in efficiency of CA during completion of cognitive tasks (Panerai et al., Am J Physiol Heart Circ Physiol 2005;289:H1202). Moreover, we did not find a similar trend of change with OV index during the rest when compared with the task (Figures 1 and 2).
Click image to enlarge.
Figure 1. OV index vs. age for 17 subjects
A. Frequencies related to autoregulation (<0.1 Hz) during the task (collapsed across No-Go and Go conditions). B. Frequencies related to respiration (0.2–0.3 Hz) during the task. C. Frequencies related to autoregulation (<0.1 Hz) during rest.
Click image to enlarge.
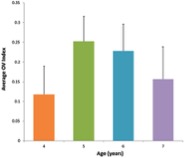
Figure 2. Average value for OV index across age groups corresponding to the frequency band <0.1 Hz during performance of the task
The OV index increases with age between 4 and 6 years and is followed by subsequent decline with age.
We also explored potential prefrontal hemodynamic biomarkers to characterize subjects with Traumatic Brain Injury (TBI) by introducing a novel task-related hemodynamic response detection followed by a heuristic search for an optimum set of hemodynamic features. The hemodynamic response from a group of 31 healthy controls and 30 chronic TBI subjects were recorded as they performed a complexity task (i.e., number of events). To identify the hemodynamic signals that show task-related hemodynamic activity, trials with negatively correlated HbO and HbR and HbO larger than HbR were considered for analysis. To identify the optimum hemodynamic features, unlike common single-feature analyses for studying TBI and healthy subjects, we evaluated all possible combinations of multiple hemodynamic features to compare the TBI and healthy populations. Eleven hemodynamic features were extracted from oxygenated hemoglobin (HbO) to determine the optimum set of biomarkers. We investigated the effectiveness of the extracted features in distinguishing TBI from healthy subjects by utilizing a machine learning classification algorithm to score all the possible combinations of features according to their predictive power. The identified optimum feature elements resulted in classification accuracy, sensitivity, and specificity of 85%, 85%, and 84%, respectively. The sensitivity value of 85% suggests that TBI subjects have been characterized for the identified biomarkers with reasonable accuracy. We conducted a spatio-temporal classification to identify regions within the prefrontal cortex (PFC) that contribute to distinguishing TBI from healthy subjects. As expected, Brodmann area (BA) 10 within the PFC was isolated as the region in which healthy subjects (unlike TBI subjects) showed major hemodynamic activity in response to the High Complexity task. Overall, our results indicate that identified temporal and spatio-temporal features from PFCs hemodynamic activity are promising biomarkers in classifying subjects with TBI (Figure 3).
Click image to enlarge.
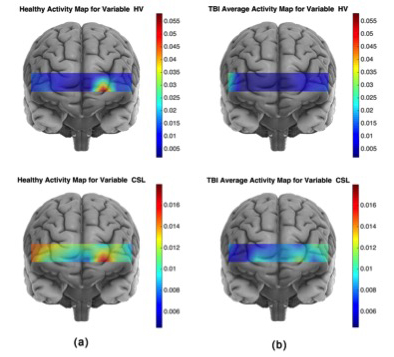
Figure 3. Average activity maps for the CSL and HV features for the healthy (a) and TBI (b) subjects
The activity map for a spatio-temporal feature associated to a population is obtained by averaging every subject's (from the corresponding population) spatio-temporal feature set. For the TBI population, the larger HV values are located at multiple locations with largest on the right hemisphere, whereas for the healthy population the largest HV is concentrated on the left hemisphere of the Brodmann area 10 (BA 10). Furthermore, on average healthy subjects show larger HV values for the HbO signal, which indicates that oxygenation signal has shown higher variation in the healthy subjects. The HbO signal in response to the High Complexity task for the healthy subjects shows larger variation and is spatially less diffuse than for the TBI subjects. Larger CSL values correspond to a faster rate of oxygenation consumption. Considering the activity map for healthy subjects, largest CSL values cover the left frontopolar of the BA 10. A comparison of healthy and TBI subjects’ CSL activity map reveals that healthy subjects have shown higher oxygenation consumption rate in response to the High complexity task at all the sites of fNIRS data collection.
Multispectral imaging
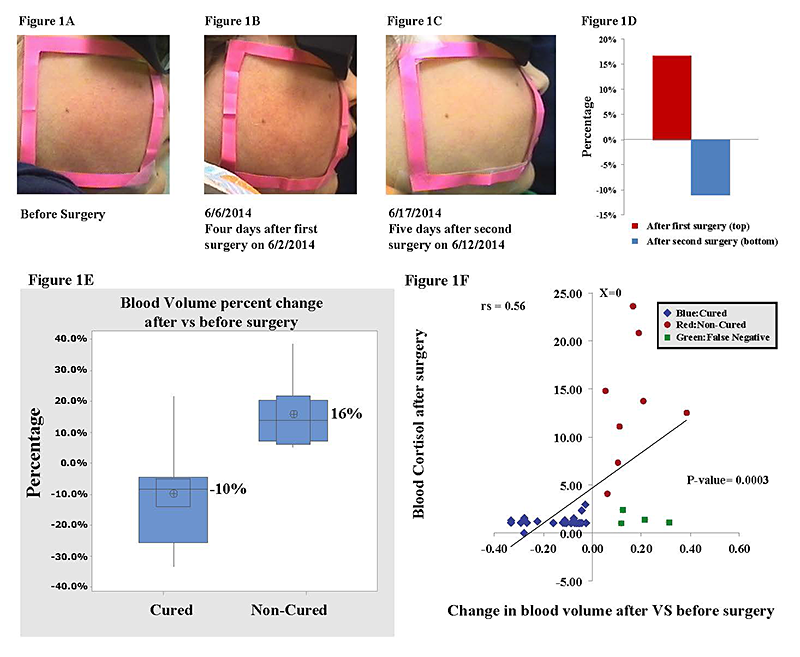
Facial redness is one of the earliest described clinical features of Cushing's syndrome (CS). We are continuing a study that is aimed at quantifying the changes of facial plethora in CS as an early assessment of cure. CS patients are recruited for optical imaging sessions, before and after surgery, with a follow-up sessions six months and one year after surgery. To date, 51 patients with CS (30 females) have been enrolled. Among these, 38 patients had CD due to ACTH–secreting pituitary tumors, five had ACTH–independent adrenocortical tumors, and two had an ectopic ACTH–secreting pulmonary carcinoid. Six patients with CD were excluded from the study—two due to severe facial acne, two to fever on the day of imaging and the last two owing to cortisol injection on imaging day. Three of the patients required two consecutive surgeries, as the initial trans-sphenoidal surgery was unsuccessful. We performed non-invasive multi-spectral near-infrared imaging on the right cheek of the patients before and two days or up to two weeks after surgery. Patients were defined as cured by postoperative measurements of plasma cortisol of less than 3 mcg/dl and/or adrenocortical insufficiency, for which they received replacement. Clinical data, obtained from the 45 patients indicate that a reduction in facial plethora after surgery, as evidenced by a decrease in blood volume fraction, is well correlated with cure of CS. The results were published (Reference 1) (Figure 4).
Click image to enlarge.
Figure 4. A–C: Facial plethora in a patient with CD before TSS, after the first TSS (non-cured), and after the second TSS (cured)
D. The blood volume fraction percentage change of the patient's left cheek in panels A–C at different imaging sessions. E. Boxplot of mean percentage change indicating change in blood volume after surgery, compared to before surgery, in each of the cured and noncured Cushing's patients. The distribution shows median confidence interval box and interquartile range. F. Change in blood volume from pre- to postsurgery vs. blood cortisol level after surgery in 34 patients undergoing 36 surgical treatments for CS.
We are also pursuing Kaposi Sarcoma (KS) studies in ongoing clinical trials under four different NCI protocols and therapeutic agents. The goal is to further evaluate diffuse multispectral imaging as a potential supplement to existing response assessment in KS, providing an early non-invasive marker of treatment efficacy. In our preliminary results, multi-spectral images of KS skin lesions were taken over the course of treatment, and blood volume and oxygenation concentration maps were obtained through Principal Component Analysis (PCA) of the data. We compared corresponding images with clinical and pathological assessment, provided by conventional means. Supporting our hypothesis that successful treatment would reduce the blood volume in the lesions, the normalized standard deviation for blood volume decreased in each of the eight patients whose lesion responded to treatment, while the normalized standard deviation for blood volume rose in two patients whose lesion did not respond to therapy. These initial results confirm that concentrations of oxygenated hemoglobin in the tumor can be a quantitative marker of tumor response to the therapy.
To map more biological chromophores, we are working on designing a new multi-spectral system that has a 12–wavelength imaging capability.
Fluorescence methods in pre-clinical studies of HER2-positive breast cancer and of basal cell carcinoma expressing BerEP4
HER2–specific fluorescently labeled probes
Detection of specific oncogenic biomarkers is an important factor in choosing the proper targeted cancer therapy. Current cancer therapy is focused on drugs that selectively attack the cancer-causing biomarkers, inactivate molecular mechanisms responsible for cell malignancy, and deliver a toxin specifically to the malignant cells. The most prominent example of this approach is the use of the monoclonal antibody (mAb) Trastuzumab antibody–drug conjugate T-DM1 to treat human epidermal growth factor receptor 2 (HER2)–positive cancers. Elevated HER2 expression is associated with increased proliferation and survival of cancer cells, thereby contributing to poor therapy outcomes. Given that the efficacy of the mAb depends on overexpression of its target on tumor cells, development of techniques to assess receptor expression is extremely important for monitoring the efficacy of therapy and optimizing treatment. Current clinical evaluation of HER2 expression is based on immunohistochemistry (IHC) or fluorescence in situ hybridization (FISH) staining of biopsied tissue. Both are ex vivo techniques and, owing to tumor heterogeneity, may deliver false-positive or false-negative results and are therefore unreliable for monitoring therapy. By contrast, molecular imaging using HER2–specific fluorescently labeled probes allows assessment of the status of HER2 receptors in vivo and the following of treatment in real time. After injection, probes such as the HER2–specific Affibody concentrate in the tumor. Probe accumulation at tumor cells can occur in parallel with the delivery of some HER2–specific drugs, such as Trastuzumab, to the malignant tumor. As a result, HER2–specific Affibody fluorescent probes can be used to monitor HER2 expression without interfering with the treatment itself, making this probe suitable for an image-and-treat paradigm.
Besides the information that can be extracted from the serial imaging of fluorescence intensity at different time points, additional information about tumor characteristics can be extracted from lifetime fluorescence measurements, including binding affinity of the probe to cancer cells and environmental conditions (e.g., pH), based on local variations in lifetimes for specially designed probes at a given site.
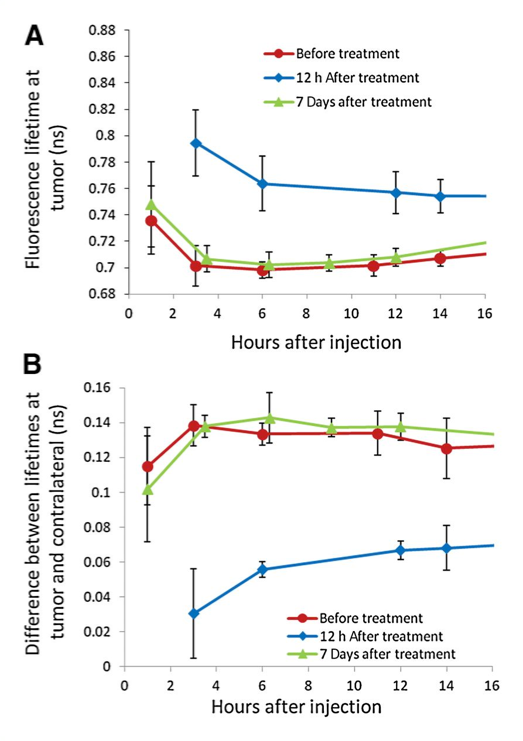
We studied the potential of in vivo fluorescence lifetime imaging to monitor the efficacy of treatment, in particular the feasibility of fluorescence lifetime imaging to monitor in vivo expression of the HER2 receptor in a breast carcinoma (mouse model) during the course of treatment. We observed a considerable difference between the fluorescence lifetime of HER2–specific optical probes at the tumor and a contralateral site before and seven days after the last treatment with 17-DMAG (an HSP90 inhibitor), when the tumor regrew to almost its pretreatment volume. However, soon after the therapy (12 hours), when the effect of drug on HER2 degradation is maximal, the difference decreased significantly. Based on our previous findings on the relationship between fluorescence lifetime and binding of a HER2–specific probe to corresponding receptors, we believe that the differences between the fluorescence lifetimes at the tumor and contralateral site, observed for mice with BT-474 xenografts after treatment with 17-DMAG, result from the strong downregulation of HER2 receptors soon after the therapy (i.e., less binding sites for the HER2–specific probe) and corresponding changes in the fraction of bound to total fluorescent probes in the tumor. Immediately after treatment, the fraction of bound to total fluorophores inside the tumor changed considerably, resulting in a noticeable increase in the average fluorescence lifetime. Subsequent tumor and HER2 expression recovery a week later caused gradual restoration of the original level of the binding ratio of HER2–targeting probe in the tumor and a corresponding return to pre-treatment values of the fluorescence lifetime. The results reveal that fluorescence lifetime imaging, based on evaluating the fraction of the bound and unbound fluorophores inside the tumor, can be used as an alternative in vivo imaging approach to characterize tumors, separate high from low HER2–expression tumors, and monitor the efficacy of targeted therapies (Figure 5).
Click image to enlarge.
Figure 5. Fluorescence lifetimes at the tumor
A. The average fluorescence lifetime at the tumor site for five mice at different time points after injection of ABD-HER2–specific Affibody probe; before, 12 hours, and one week after the last treatment with 17-DMAG.
B. The difference between the fluorescence lifetimes at the tumor and contralateral site for the same mice as in panel A.
Molecular biomarkers targeting basal cell carcinoma (BCC) towards development of theranostics to diagnose, treat, and follow up BCC
In collaboration with Alan Halpern, we conducted a pilot study to determine the affinity and selectivity of BerEp4 antibody conjugated with fluorescence probe and to assess its possible use in designing theranostic probes for BCC. BCC appears macroscopically and microscopically similar to many other skin lesions, which makes differential diagnosis difficult. Based on initial cell culture results, BerEP4 appears to be a promising biomarker for molecular imaging of BCC and can be used in conjunction with in vivo near-infrared fluorescence imaging. To prepare BerEP4 for eventual theranostic use, we examined the feasibility of a combined macro-/micro-optical approach to imaging BCC with various histologies.
With an annual incidence of 3.5 million per year in U.S., BCC is the most common cancer in humans. Although, the rate of metastasis is very rare, it warrants treatment owing to local destruction and associated morbidities and even mortalities if left untreated. The current standard of care has changed little in the past 100 years. Like any other skin cancer, BCC is diagnosed by biopsy, followed by histopathology evaluation. Once diagnosed, the lesion is surgically removed to achieve cure. Such a process is time consuming, highly trained labor–intensive, invasive (biopsy and surgery), and very costly. The cost of diagnosis and treatment (simple or Mohs micrographic surgery) in U.S. alone is estimated to be 7–10 billion dollars. EpCam is an ideal biomarker to target BCC because it is expressed in more than 95% of human BCC. More importantly, healthy stratified squamous cell epithelium expresses negligible amount of EpCAM, and benign lesions such as actinic keratosis and seborrheic keratosis do not express this biomarker.
During an in vitro phase, we showed specificity and selectivity of BerEP4 antibody to target EpCAM on live cells. In the subsequent in vivo phase, using xenograft mouse models, we reproduced persisting in vivo specificity and selectivity of BerEP4 antibody to detect EpCAM–expressing xenograft tumors, when injected systemically via tail veins (Figure 6). Moving forward, we plan to take the following steps: (1) modify our antibody to a smaller molecule—a stable aptamer or single strand antibody—to facilitate topical deliver (instead of systemic) for skin cancer; (2) repeat the in vivo experiment to show reproducible results with modified and smaller probe; this phase would encompass initial systemic injection of the probe followed by experiments to test ways to best achieve topical delivery, including micro-injection; (3) once in vivo non-invasive targeting of BCC is achieved via topical introduction, we plan to further engineer our diagnostic probe to be photosensitized to achieve photodynamic treatment at the time of diagnosis.
Click image to enlarge.
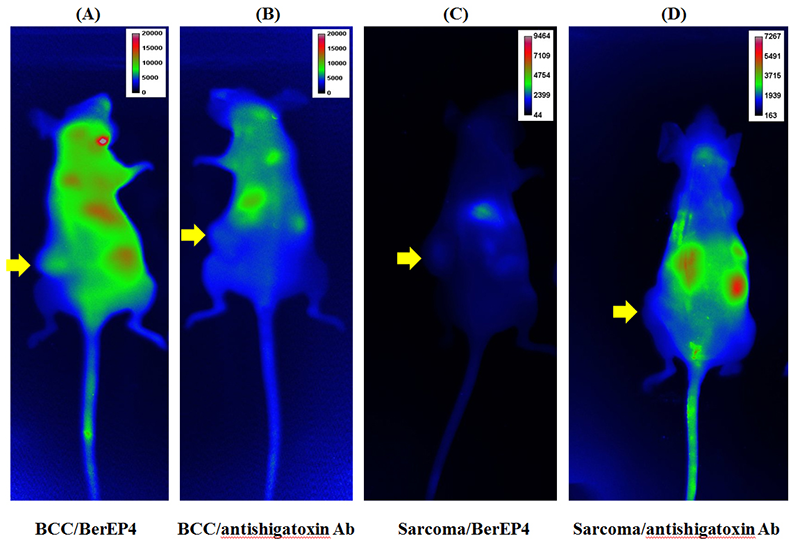
Figure 6. A and B: BCC (EpCAM–expressing xenograft mice model). C and D; sarcoma (EpCAM–negative xenograft mice model) labeled with BerEP4 antibody (+ve probe) or anti-shigatoxin antibody (-ve probe)
As illustrated, only BCC mice (A) (+ve biomarker) labeled with BerEP4 Ab (+ve probe) shows the presence of fluorescence-conjugated antibody at the site of the tumor, 6 hours after tail vein injection, which is consistent with a persisting in vivo affinity and selectivity of our molecular probe (BerEP4 Ab) to detect presence of EpCAM expression on tumor cells. Alexa-750 was used as the fluorescent chromophore conjugated with antibody (BerEP4 and anti-shigatoxin) for all experiments. The yellow arrows point to the location of the xenograft tumors in mice.
Publications
- Afshari A, Ardeshirpour Y, Lodish MB, Gourgari E, Sinaii N, Keil M, Belyavskaya E, Lyssikatos C, Chowdhry FA, Chernomordik V, Anderson AA, Mazzuchi TA, Gandjbakhche A, Stratakis CA. Facial plethora: modern technology for quantifying an ancient clinical sign and its use in Cushing syndrome. J Clin Endocrinol Metab 2015; 3928-3933.
- Karamzadeh N, Ardeshirpour Y, Kellman M, Chowdhry F, Anderson A, Chorlian D, Wegman E, Gandjbakhche A. Relative brain signature: a population-based feature extraction procedure to identify functional biomarkers in the brain of alcoholics. Brain Behav 2015; e00335.
- Amyot F, Arciniegas DB, Brazaitis MP, Curley KC, Diaz-Arrastia R, Gandjbakhche A, Herscovitch P, Hinds SR 2nd, Manley GT, Pacifico A, Razumovsky A, Riley J, Salzer W, Shih R, Smirniotopoulos JG, Stocker D. A review of the effectiveness of neuroimaging modalities for the detection of traumatic brain injury. J Neurotrauma 2015; 32(22):1693-721.
- Dasgeb B, Smirnov A, Ardeshirpour Y, Gandjbakhche A, Halpern A, Knutson JR, Mehregan D, Sackett DL. Multi-scale BerEp4 molecular imaging of microtumor phantom towards theranostics for basal cell carcinoma. Mol Imaging 2014; 13:1-9.
- Anderson AA, Smith E, Chernomordik V, Ardeshirpour Y, Chowdhry F, Thurm A, Black D, Matthews D, Rennert O, Gandjbakhche AH. Prefrontal cortex hemodynamics and age: a pilot study using functional near infrared spectroscopy in children. Front Neurosci 2014; 8:393.
Collaborators
- Samuel Achilefu, PhD, Washington University School of Medicine, St. Louis, MO
- Robert Balaban, PhD, Laboratory of Cardiac Energetics, NHLBI, Bethesda, MD
- Claude Boccara, PhD, École Supérieure de Physique et de Chimie Industrielles, Paris, France
- Kevin Camphausen, PhD, Radiation Oncology Branch, NCI, Bethesda, MD
- Christian Combs, PhD, Light Microscopy Facility, NHLBI, Bethesda, MD
- Stavros Demos, PhD, Lawrence Livermore National Laboratory, Livermore, CA
- Ramon Diaz-Arrastia, MD, PhD, Center for Neuroscience and Regenerative Medicine, Uniformed Services University of the Health Sciences, Bethesda, MD
- Israel Gannot, PhD, Tel Aviv University, Tel Aviv, Israel, and The George Washington University, Washington, DC
- Gary Griffiths, PhD, Imaging Probe Development Center, NIH, Rockville, MD
- Alan Halpern, MD, Memorial Sloan-Kettering Cancer Center, New York, NY
- Ilko Ilev, PhD, Office of Science and Engineering Laboratories, FDA, Bethesda, MD
- Albert Jin, PhD, Laboratory of Cellular Imaging and Macromolecular Biophysics, NIBIB, Bethesda, MD
- Jay Knutson, PhD, Laboratory of Molecular Biophysics, NHLBI, Bethesda, MD
- Maya Lodish, MD, Pediatric Endocrinology Training Program, NICHD, Bethesda, MD
- Ralph Nossal, PhD, Program in Physical Biology, NICHD, Bethesda, MD
- Sinisa Pajevic, PhD, Division of Computational Bioscience, CIT, NIH, Bethesda, MD
- Tom Pohida, MS, Division of Computational Bioscience, CIT, NIH, Bethesda, MD
- Dan Sackett, PhD, Program in Physical Biology, NICHD, Bethesda, MD
- Alexsandr Smirnov, PhD, Light Microscopy Facility, NHLBI, Bethesda, MD
- Constantine Stratakis, MD, D(med)Sci, Program on Developmental Endocrinology and Genetics, NICHD, Bethesda, MD
- Audrey Thurm, PhD, Pediatrics & Developmental Neuropsychiatry Branch, NIMH, Bethesda, MD
- Eric Wassermann, MD, Cognitive Neuroscience Section, NINDS, Bethesda, MD
- Robert Yarchoan, MD, HIV and AIDS Malignancy Branch, NCI, Bethesda, MD
Contact
For more information, email amir@helix.nih.gov.